Genspace experiment proposal

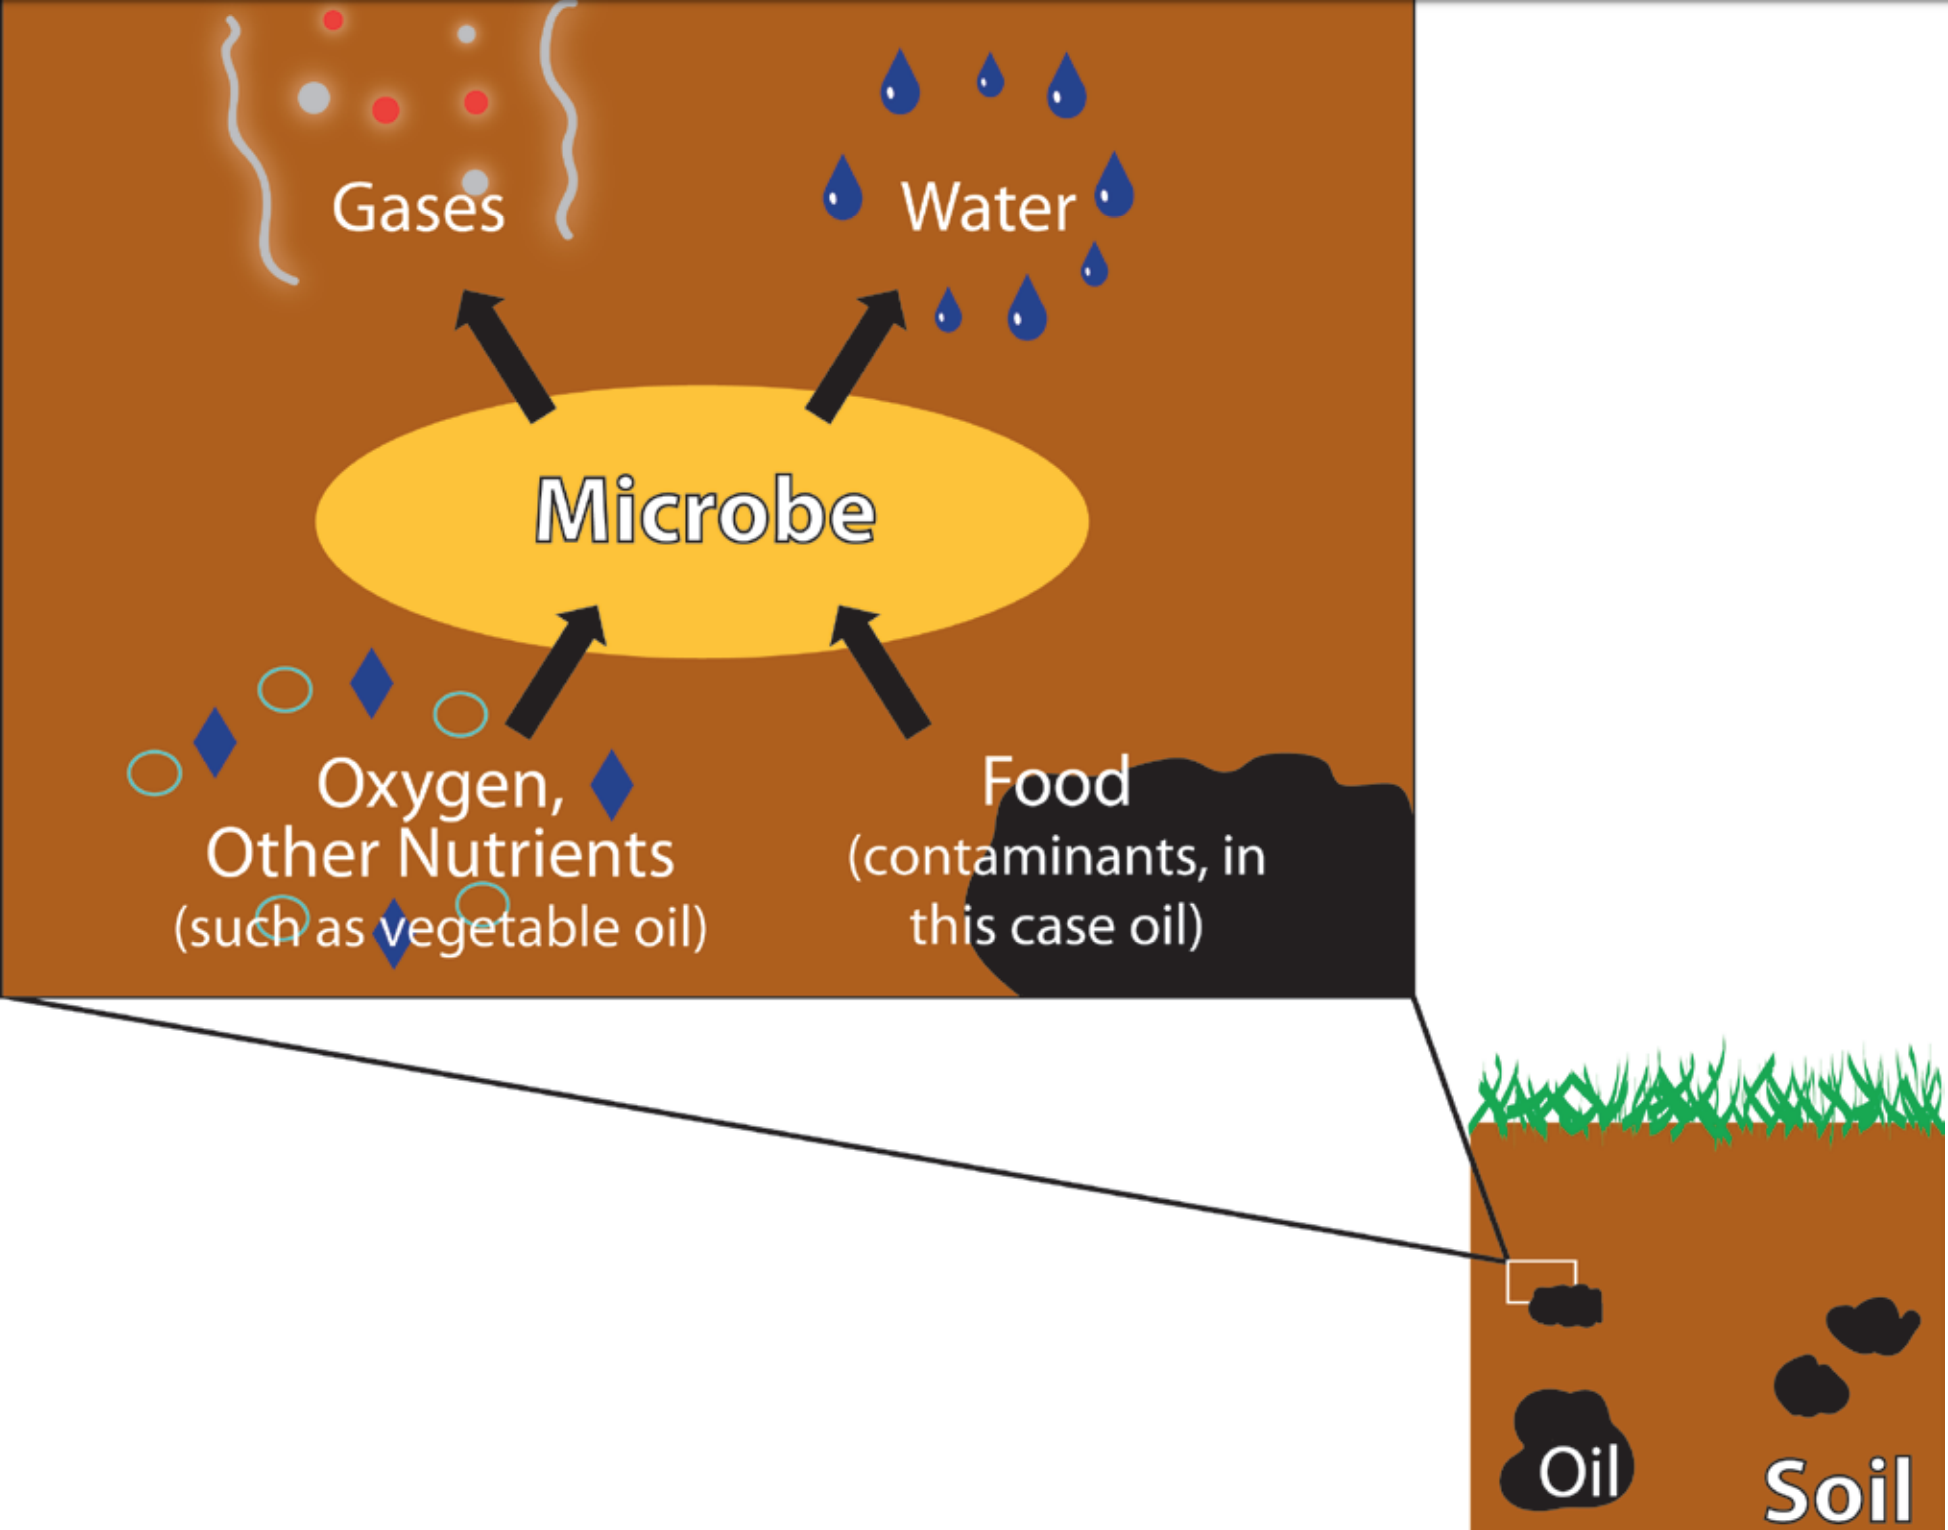
As a continuation of my temporary expert assignment in which I researched Bioremediation and different ways of using metaphors in order to explain how it works, I want to expand my research in Genspace by conducting an experiment that will allow me to visualize and understand bioremediation.

By doing some research on how to perform bioremediation without toxic waste involved, I came across a simple exercise that consists on a sugar spill, by using yeast (as a bacteria) to consume the sugar when it’s mixed with water in test tubes, and collecting the generated gases with a balloon, I would be able to replicate the way that bacteria and toxic waste interact during the bioremediation process.

Yeast consuming sugar spill experiment

Yeast consuming sugar spill experiment

The sugar spill experiment is a simple and very visual way to represent bioremediation, however, I’m 100% interested in doing something similar but using the resources and the scientific method at Genspace. This simple experiment might not be enough to provide a clear way to quantify the good performance of bacteria and at the same time, it doesn’t provide a way to understand if the bacteria are having the appropriate conditions to “eat more”, which is the basis of my research and hopefully the element that I would like to use for my final project.

I would like to find substances that will require me going to do the experiment in Genspace and hopefully be able to quantify how much gas is produced, or in a more broad way, be able to determine when the bacteria are in ideal condition to be able to “eat more” and therefore clean more the environment (consuming more toxic waste in a real-life application of bioremediation).

Later in my research I came across a more detailed experiment that involves (I believe) toxic waste: Measuring the concentration of BAC in lake water samples. BAC = benzalkonium chloride.

Measuring the concentration of BAC in lake water samples

Measuring the concentration of BAC in lake water samples

I would like to find a middle point between these two experiments to be able to do it in Genspace, in which I can measure results (concentration of the “simulated toxic substance” (nontoxic in case of the experiment in Genspace).

Final Proposal for Genspace

My final proposal involves using mycelium to digest cigarette but. Ideally I will collect them from the street, I could quantify the amount and the location from where I collect them (maybe generate a story out of it once I have done the experiment) and then be able to connect it to the science.

As my experiment I want to be able to digest cigarette buts by using some kind of mycelium. The concept that I am pursuing is how to go from something “dirty or toxic” to something clean, and how to understand the conditions that the mushrooms need in order to “eat more” and therefore clean more.

Digest cigarette but

Digest cigarette but

Live Web Midterm Project | Road to Recovery

For my midterm assignment I decided to work on a platform that enables collaborative PT sessions for patients recovering from injuries. It enables the PT to teach the exercises and use RTC in order to track the quality of the exercises and quantify the ones that have been correctly performed by the patients.

The goal for this assignment in term of the technology used was to be able to use the peer.js library and websockets to send data to the patient side. My first attempt was to make the peer.js work with a different visualization for each side (PT and patient).

Midterm Proposal | face-to-face PT session

For my midterm assignment, I would like to explore the possibility of developing a technology that will enable patients to have their PT sessions remotely but having a collaborative and controlled environment as they have in the PT clinic.

There are a lot of apps out there that have tried to achieve this behavior however I would like to focus on setting milestones and for the patient to be able to do the exercises and receive motivation guidance and instructions in real time.

Virtual PT

Virtual PT

Physera

Physera

I am aware this might be a project to pursue for my final however I would like to start the exploration of the functionalities for my midterm.

Gene Drive: The Pangolin

The role of advance genomics in conservation biology of endangered species

For my Gene Drive assignment I was very conflicted with the idea of changing something on a species for “selfish” reasons, while trying to come up with an idea of a gene drive that wouldn’t affect their environment or other species in a negative way, I attended to the event: Existential Medicine #5: CRISPR - Edited Humanity in New Lab, in this even I met one of the participants, a Bio Geneticist who works for a pharmaceutical company in Cambridge and before the event started we started talking about the potential of CRISPR, our different backgrounds and how important it was to be able to be part of the conversation, no matter our daily job or education.

During the talk one of the panelists talked about a famous case of CRISPR (famous for other people but it was totally new for me) in which scientists are trying to edit the Cavendish’s (the most consumed species of banana) genome with CRISPR to boost its resilience to TR4 (a deadly fungus), instead of inserting foreign genes. This was fascinating to me, because saving an already existing species, and leaving it the way they are meant that I wouldn’t do any damage to the environment or other plants or animals, however I would be saving the species, in this case, the banana. The conversation in the panel at this point changed to discuss whether or not they would eat a genetically modified banana, and the guest that I have just met in the conference turned to me and said, I believe it would be better to eat a genetically modified banana instead of a banana that has a lot of chemicals and/or contains foreign genes instead of a modification of its own gene (interesting enough, all the panelists agreed that they would 100% eat a banana genetically modified with CRISPR).

At this point I was decided that my Gene Drive assignment was going to be focussed on saving a species in danger of extinction, the only remaining part was to find which species and decide how to use CRISPR to modify one of the alleles in order to be passed with more frequency and be able to propagate the new species in their environment.

Gene Drive: The Pangolin

According to pangolinsg.org Pangolins, or scaly anteaters as they are otherwise known, are unique mammals covered in hard scales, comprised of keratin. They predate almost exclusively on ants and termites and are predominantly nocturnal and elusive, secretive mammals.

The Pangolin

Most pangolins in illicit, international trade end up in China and Vietnam. Here the meat of the animals is consumed as a delicacy, but it is also believed to impart health benefits such as nourishing the kidneys. Despite a lack of evidence suggesting they’re effective, pangolin scales are used as an ingredient in traditional Asian medicine to help breastfeeding women lactate milk, to cure ailments ranging from asthma and psoriasis to cancer, and to improve blood circulation.

-In this remote part of the Central African Republic, poaching for the overseas wildlife trade is not yet widespread, but pangolins are seen as food. They are easy prey; a pangolin’s defence strategy is to roll into a scaly ball (their name comes from the Malay pengguling – “something that rolls up”). This makes it difficult for most predators to eat them but all too convenient for human hands intent on scooping them up and putting them into a sack.- Post Magazine

Defense mechanism

According to the Post Magazine article in April 2019, authorities in Singapore seized nearly 13 tonnes of scales in a container en route from Nigeria to Vietnam, a haul valued at US$38 million. It is estimated 17,000 pangolins would have been killed for this shipment and scales from all four African species were identi­fied. In February, 30 tonnes of frozen pangolins were seized in Sabah, Malaysia’s biggest bust to date, and the previous month, Hong Kong authorities found eight tonnes of scales in a container from Nigeria bound for Vietnam.

One pangolin is poached from the wild every five minutes

My design question for the assignment was, how to prevent the trafficking of Pangolins by genetically modifying al allele with CRISPR? I decided to focus on the flavor factor. Pangolins are trafficked, among other reasons, for the exotic and good taste of their meat. It is sold as a delicatessen which means that people pay high amounts of money to be able to eat something delicious, exotic, that they can’t eat every day. People are willing to pay a lot of money which means that people are willing to remove the Pangolins from their environment and kill them in order for people to try their exotic meat, no matter if they are about to be extinct.

What would happen if a group of scientists using CRISPR where able to genetically modify the pangolin by changing the paste of the meat for human perception? It would have to be a subtle change so that their predators don’t get affected by this change and therefore the food chain remains the same, however it has to be a noticeable enough change so that humans stop trafficking the Pangolin for the taste of their meat.

In this assignment I have decided to use an edible metaphor to exemplify the process of a gene drive in Pangolins and how the offer and demand would change in order for humans to reduce the amount of trafficked species and hopefully save the Pangolins from extinction.

Note: details of the activity will be added after class in order to avoid spoilers!

Emoji-me

For this week’s assignment I decided to focus on understanding the code provided in class and to make simple changes in order to generate a concept around the functionalities that were already working in the example. I have found difficulties to both practice and understand the code and come up with a creative concept at the same time in a one week period of time.

I started by deciding to sketch some ideas out and then try to define the steps in the code that I needed in order to achieve that basic functionality. Defining my intentionality in design before I started to code was of huge help to prioritize in order to be able to finalize the project.

Wireframing and ideation process

Wireframing and ideation process

I decided to build a game-like platform for users to imitate the emoji faces that were being prompted to them and meanwhile the other users will also imitate the emoji faces and they would eventually be displayed in everyone’s screen. I started by creating the emoji function, every time that the user opens the page they would be prompted with a new emoji to try, however I was facing the problem that I wanted this interaction to happen multiple times, when the user take one picture then the system would display the next emoji and so on.

Testing some emoji faces

Testing some emoji faces

The emoji function

The emoji function

After I was able to implement the emoji functionality every time after the picture was captured, I divided the right side of the screen vertically with two pictures, the one on top will be the picture that each user is taking (socket.emit) and the picture in the button will be rotating with all the pictures received from different users that are connected to the server at the same time.

Final implementation

Final implementation

Week 3 | Temporary Expert: Bioremediation

The in-class assignment helped me to determine which aspects of the bioremediation I would like to explore for my midterm assignment, I’m particularly interested in the fact that organisms feed from toxic waste and that waste is their fuel and energy to maintain them alive. I’m fascinated by the idea that something that is supposed to kill (for example, toxic waste is supposed to kill humans) however, this organisms somehow find a way to use that as food and by doing that it improves the conditions of their environment. I Im very interested in understanding what are the conditions that are necessary for that to happen and how everyday citizens can get involved in that process, what are the steps and the materials needed in order for this microbes to “eat more contaminants”.

From nothing to something

From nothing to something

Creating our new screensaver together

For this weeks assignment I wanted to work on a collaborative way of creating a visual pattern, my main goal was to provide the users with the possibility of generating patterns that would be visually relaxing and interesting to create. I have been exploring mirroring the screen in 4 quadrants in order to generate those patterns.

My first test was to make sure that the other user (not me) would have a different color and that I was able to receive their movements and they would receive mines, I started by only generated one mirrored element (circle) which was also joint by the line, this was, of course, a mistake that I later tried to fix, however at this point I considered keeping the line in the middle.

Fist collaborative test

Fist collaborative test

It took some experimentation with the shapes and colors until I landed in a visual that I felt satisfied with. The way that I decided to handle different users is, I created two different arrays, one for the colors (which I previously defined in Adobe Illustrator to make sure that they compose a uniform palette and then I also created an array for different predetermined diameters for the drawings. I had to make sure that all the colors have transparency so that the effect in the screensaver will be better.

Color and diameter array

Color and diameter array

Color Palette

Color Palette

The next step in the process was to generate the 4 quadrants mirror functionality, which I had explore before in the past however I have to make sure that I could apply it to the html5 canvas element. I was able to remove the line in the center of the two circles and correctly mirror each circle in the 3 remaining quadrants.

Mirrored quadrants

Mirrored quadrants

Code for Quadrants

Code for Quadrants

The last part of the process was to test the creation of different visually interesting patterns with different users and how the collaboration will encourage users to generate their own drawings together.

Data Selfie | Being a morning person

For my quantified self assignment I decided to track something that characterizes me as a person in order to create a data driven self portrait. I have always been a morning person, since I was a kid, my mom used to tell stories on how I wouldn’t let her or my dad sleep until late on weekends because I was already up and asking for breakfast since 6 in the morning. This is a characteristic that i have tried to use in my advantage in my adult life because it helps me be more productive and achieve a healthier lifestyle if I’m able to start my days at 6:00 am.

The way that I decided to track myself was by using a Google form, I designed it in a way I would be able to have different data entries, which I would later decide how to use. I collected my intended wake up time and my actual wake up time, all the activities done during the morning (selected with checkboxes), and the time that I arrived to my destination. My intention was to be able to visualize my very productive mornings versus the mornings that I “failed”, for example, on Thursday I intended to wake up at 6:00 am however I snoozed my alarm and woke up at 7:00 am instead, therefore I wasn’t able to go for a run that morning and in my head that counted as a non productive morning. I was particularly curious about how all of this information that I collected was going to look like in a unified graphic.

Mobile phone data collection

Mobile phone data collection

Data Analysis

Data Analysis

One I collected the information I started to sketch different ways to map the information in a radial distribution, I wanted to relate each day to an individual line and be able to compare the productivity of each morning in a very intuitive way.

Sketching

Sketching

Sketching

Once I had started to implement the data in my code by creating a .json file from the .csv file that I downloaded from the google form, I started to think about the visual design of the information, the use of shapes and different colors to represent the data in order for the viewers to understand the content of the graph. I used Adobe Illustrator to define a color palette, the diameter of the circles and the thickness of the lines, and later on, apply those visual details to my code.

Prototyping in Illustrator

Prototyping in Illustrator

Once I started to move forward with the coding portion of the assignment I started to face some barriers, I noticed that I should have created a more object oriented programming code in order to be able to access each individual day’s data, and I also notices how the visualization of the amount of activities was missing some context and I wasn’t able to display it in the way that I originally intended in my visual design. It was important to notice that in my Illustrator file I was able to create a design with a lot of freedom however when it comes to coding, that freedom has it’s consequences because that means that the coding will get more complex and I might not be in a point where I can achieve all those components.

Test1
test2

For the coding portion of the assignment I used p5.js in order to create the circular distribution of the days by using the cos and sin functions and creating different shapes (ellipses and lines) that were distributed in radial lines by dividing a circle in 7 in order to represent the totality of the collected data (7 days of the week).

code.png

The final result is a data visualization that shows the intended wake up time (blue dot), the actual wake up time (purple dot) and the time that I arrived to my destination (pink dot). All those data points are displayed in a radial layout and I decided to represent the “effective” morning time by changing the stroke weight and the color for turquoise. It is possible to identify visually the duration of each morning and compare with the other days of the week. The last layer of information that I included was the mapping of the amount of activities done each morning, to the diameter of the semi-transparent turquoise circle that is located in the center of each morning stroke, the bigger the circle the more activities I performed that morning.

It is possible to visualize the difference between very productive mornings, such as Monday and Tuesday, in which the duration of the morning was short but the amount of activities performed was big, versus days like Saturday, in which my morning was very long however I didn’t perform many activities, therefore was a more inefficient morning.

Final Visualization

Final Visualization

Week 2 | Temporary Expert: Bioremediation

What Is Bioremediation?

Bioremediation is the use of microbes to clean up contaminated soil and groundwater. Microbes are very small organisms, such as bacteria, that live naturally in the environment. Bioremediation stimulates the growth of certain microbes that use contaminants as a source of food and energy. Contaminants treated using bioremediation include oil and other petroleum products, solvents, and pesticides.

How Does It Work?

Some types of microbes eat and digest contaminants, usually changing them into small amounts of water and harmless gases like carbon dioxide and ethene. If soil and groundwater do not have enough of the right microbes, they can be added in a process called “bioaugmentation.” For bioremediation to be effective, the right temperature, nutrients, and food also must be present. Proper conditions allow the right microbes to grow and multiply—and eat more contaminants. If conditions are not right, microbes grow too slowly or die, and contaminants are not cleaned up. Conditions may be improved by adding “amendments.” Amendments range from household items like molasses and vegetable oil, to air and chemicals that produce oxygen. Amendments are often pumped underground through wells to treat soil and groundwater in situ (in place).

Bioremediation diagram

Bioremediation diagram

Why Use Bioremediation?

Bioremediation has the advantage of using natural processes to clean up sites. Because it may not require as much equipment, labor, or energy as some cleanup methods, it can be cheaper. Another advantage is that contaminated soil and groundwater are treated onsite without having to dig, pump, and transport them elsewhere for treatment. Because microbes change the harmful chemicals into small amounts of water and gases, few if any waste byproducts are created. Bioremediation has successfully cleaned up many polluted sites and has been selected or is being used at over 100 Superfund sites across the country.

Example:

Bioremediation is cleaning up groundwater contaminated with dry cleaning solvent at the Iceland Coin Laundry Superfund site in New Jersey. To improve the conditions at the site for bioremediation, amendments were added. A solution of vegetable oil and baking soda was injected into the groundwater in an area of particularly high contaminant concentrations. Bacteria also were added to increase the existing population of microbes. The treatment area is about 1800 feet long, 500 feet wide and extends 40 feet below ground. Preliminary testing of the groundwater has shown that bioremediation is working and contaminant concentrations are decreasing. The objective is to continue to reduce the concentration of contaminants from 10 or more parts per billion to less than 1 part per billion.

Transgenic Pseudomonas bacteria capable of degrading toxic compounds that contain chlorine (such as vinyl chloride).

Some ongoing developments related to microbial remediation:

  • Bacteria that can degrade some of the components of oil.

  • Powerful bacteria reduce highly toxic forms of mercury into less toxic and volatile ones.

  • Bacteria that transform soil metals (such as chromium) into less toxic or insoluble forms.

  • Aggressive microorganisms to degrade TNT, an explosive of great power and very aggressive for the environment.

  • Bacteria that can remove sulfur from fossil fuels, such as coal or oil, to allow cleaner combustion.

  • The use of the bacterium Deinococcus radiodurans to eliminate radioactive elements present in the soil and groundwater. This microorganism is an extremophile that resists radiation, sequence, oxidizing agents and various mutagenic compounds.

  • Cyanobacteria that have been activated genes of Pseudomonas bacteria capable of degrading different hydrocarbons or pesticides.

  • Transgenic bacteria that are used to extract valuable metals from factory or mine waste, or to eliminate oil spills, or the sulphide that causes acid rain produced by coal power plants.

Sources:

http://www.argenbio.org/index.php?action=novedades&note=202

https://www.nap.edu/read/2131/chapter/4

https://www.nature.com/subjects/bioremediation

https://clu-in.org/download/Citizens/a_citizens_guide_to_bioremediation.pdf

https://www.ncbi.nlm.nih.gov/pmc/articles/PMC5026719/


Week 2: Chat

For this week assignment I worked on setting up a chat using web-sockets. The biggest challenge was to set everything up and running and after I was able to do so I decided to change the visualization and the content of the chat messaging board.

The first step was to make possible for a user that sent a text to see the content instead of just sending it and it disappearing.

Test 1: Make the sent message visible

Test 1: Make the sent message visible

The second step was to design a look and feel that was appropriate following some best practices, I decided to design it with “Dark mode” since it has been proven to be better for the eyes. I started the design process in sketch to be able to test color and size before implementing it in the code.

Design process using Sketch

Design process using Sketch

The next step was to try to implement the User Interface Design previously created in sketch. This was a very challenging part specially because the divs for “outgoing” and “incoming” messages were being generated from the chat, therefore the information architecture had to be generated from there. My biggest challenge, and the one that I wasn’t able to solve, was to be able to visualize each bubble of text to the left and to the right, according to outgoing and incoming, but occupying the entire width of the container div.

challenge

The final result is a compliment chat that invites the users to give an anonymous compliment to the users in the connected users.