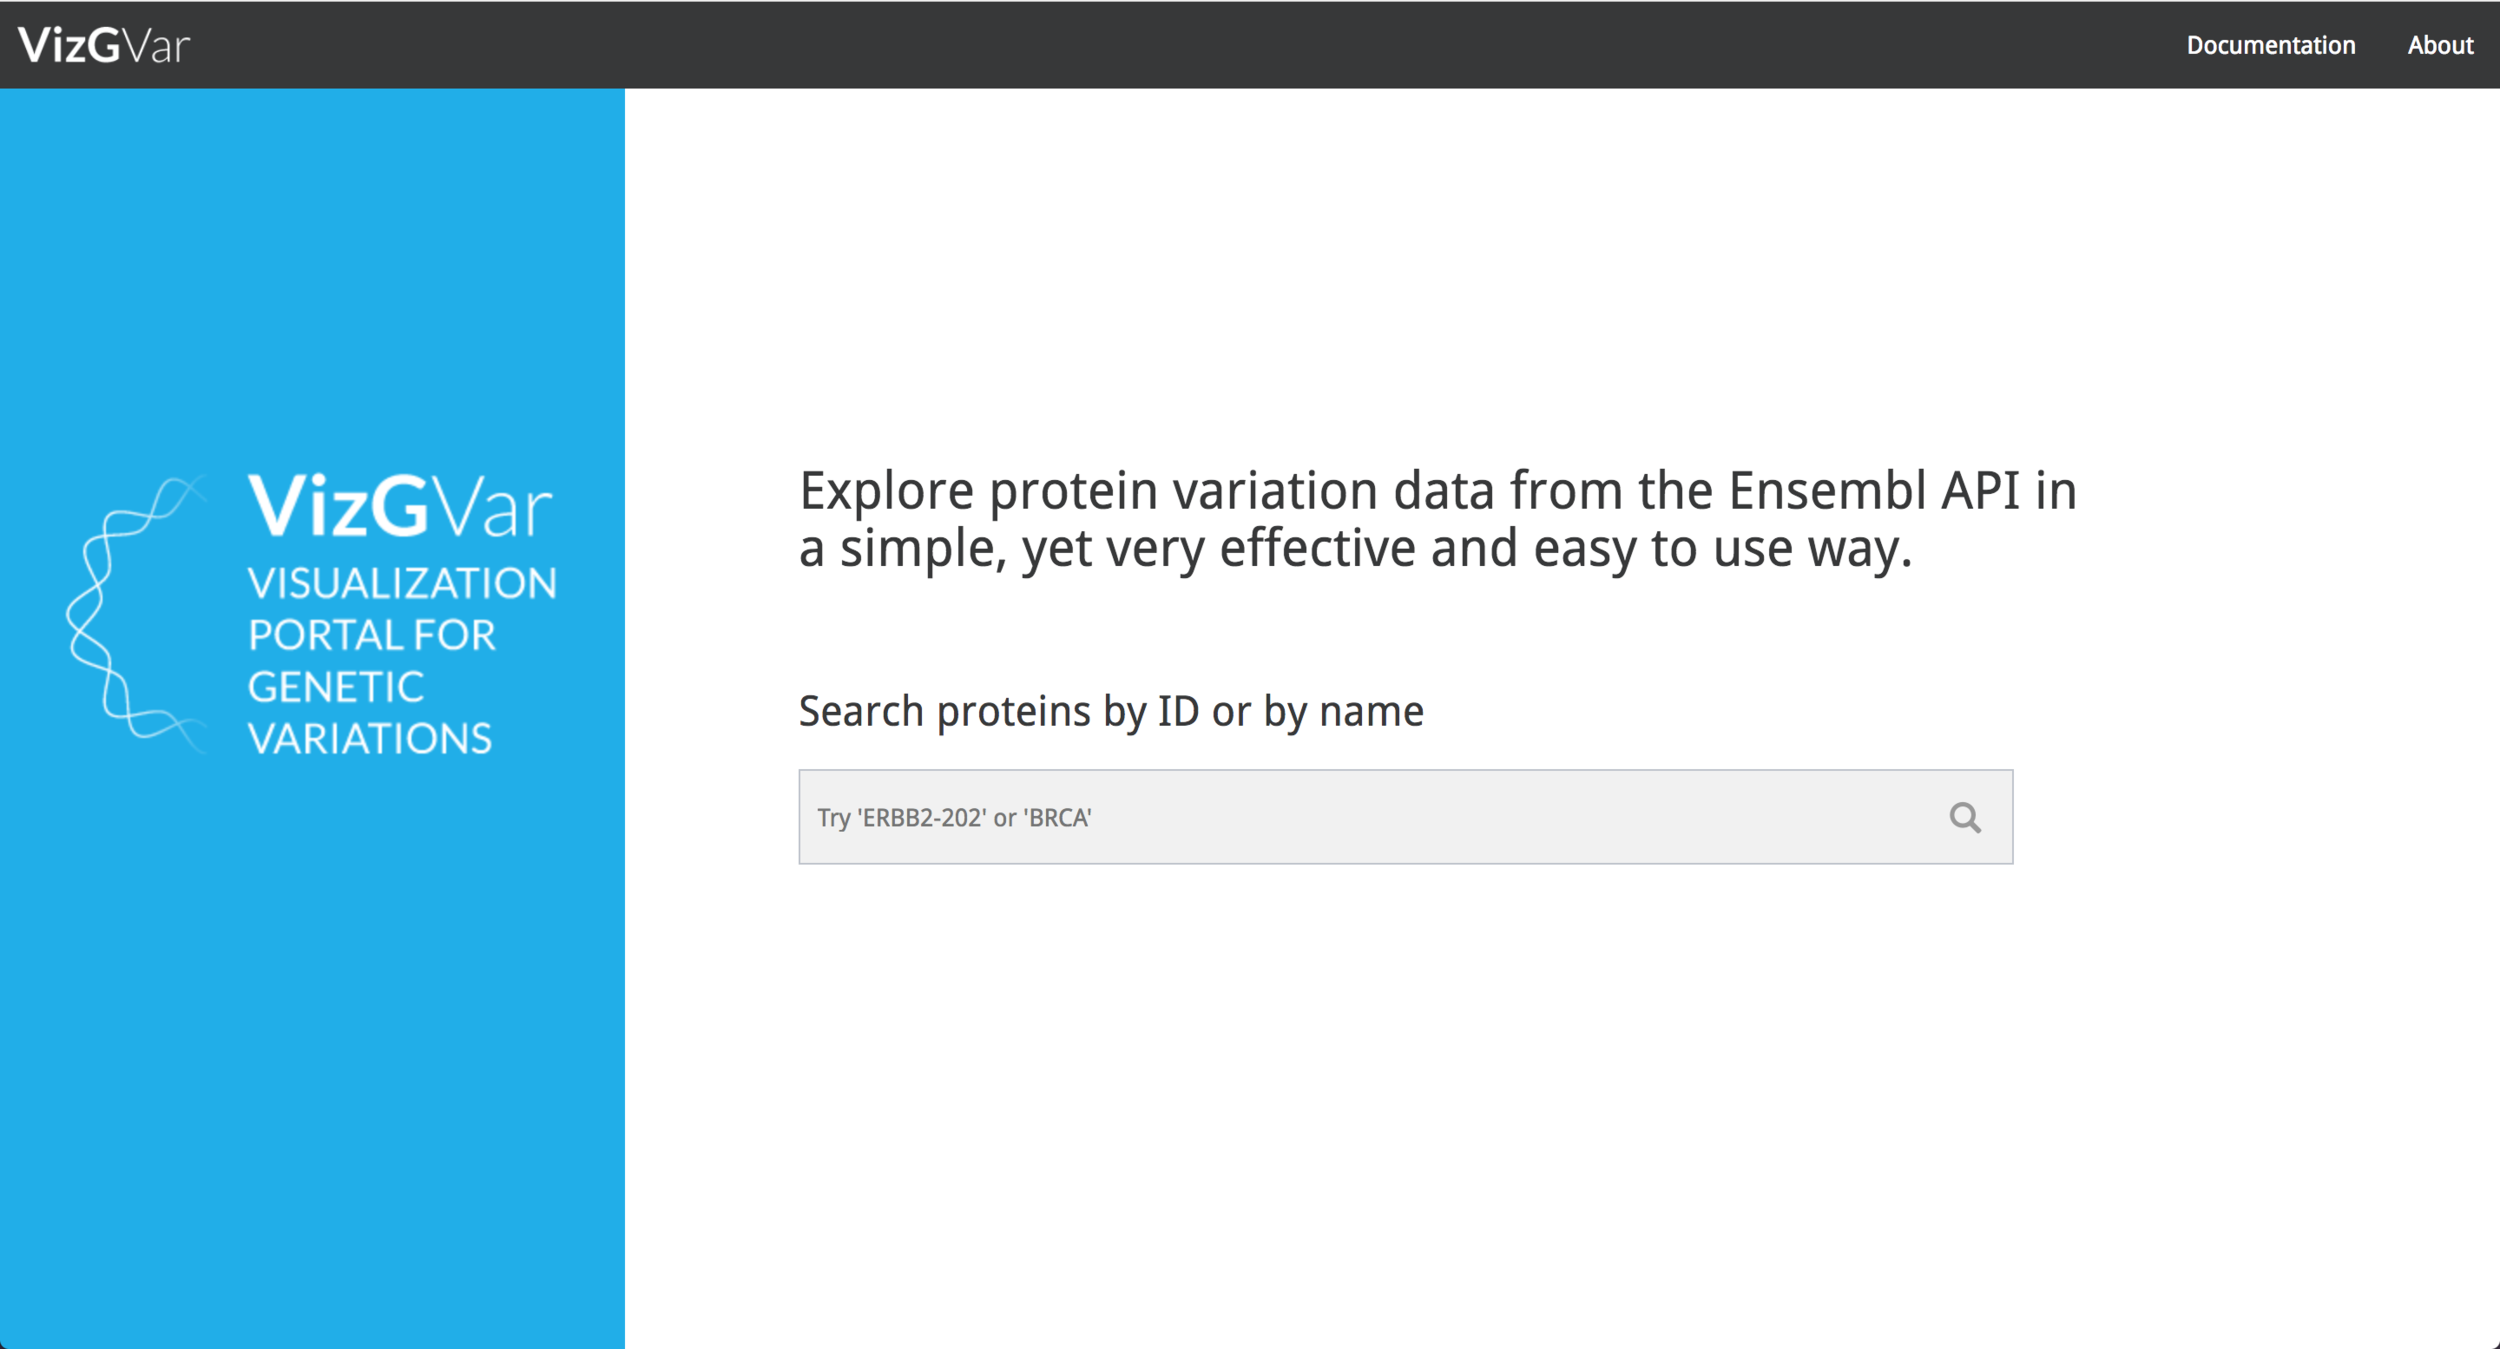
VizPort (VizGvar)
Graduation project for the Bachelor of Engineering in Industrial Design developed in the Tecnológico de Costa Rica University. VizPort is a data visualization tool originally developed for proteins related to breast cancer, such as HER-2, BRCA1 and BRCA2 and has subsequently evolved to be able to visualize all the proteins currently contained in the EBI Database. This tool enables research teams to investigate the proteins more efficiently.
This project was developed alongside with Antonio Solano under the mentoring of Franklin Hernández and Allan Orozco and the collaboration of the developer Carlos Cruz. The team members wrote a paper about the tool under the name: Visualization portal for genetic variation (VizGVar): a tool for interactive visualization of SNPs and somatic mutations in exons, genes and protein domains. (Please note that the following link has limited access, do not share on social media).

The problem
Biological databases like Ensembl are not displaying data in an intuitive way, making cancer researchers and other professionals that interact with such data to invest longer periods of time in order to to be able to understand and extract information from databases. The usability problems become blockers in the processes that lengthen the periods of investigation and even increase the possibility of errors being made due to the manual correlation of data between several databases and platforms of information.
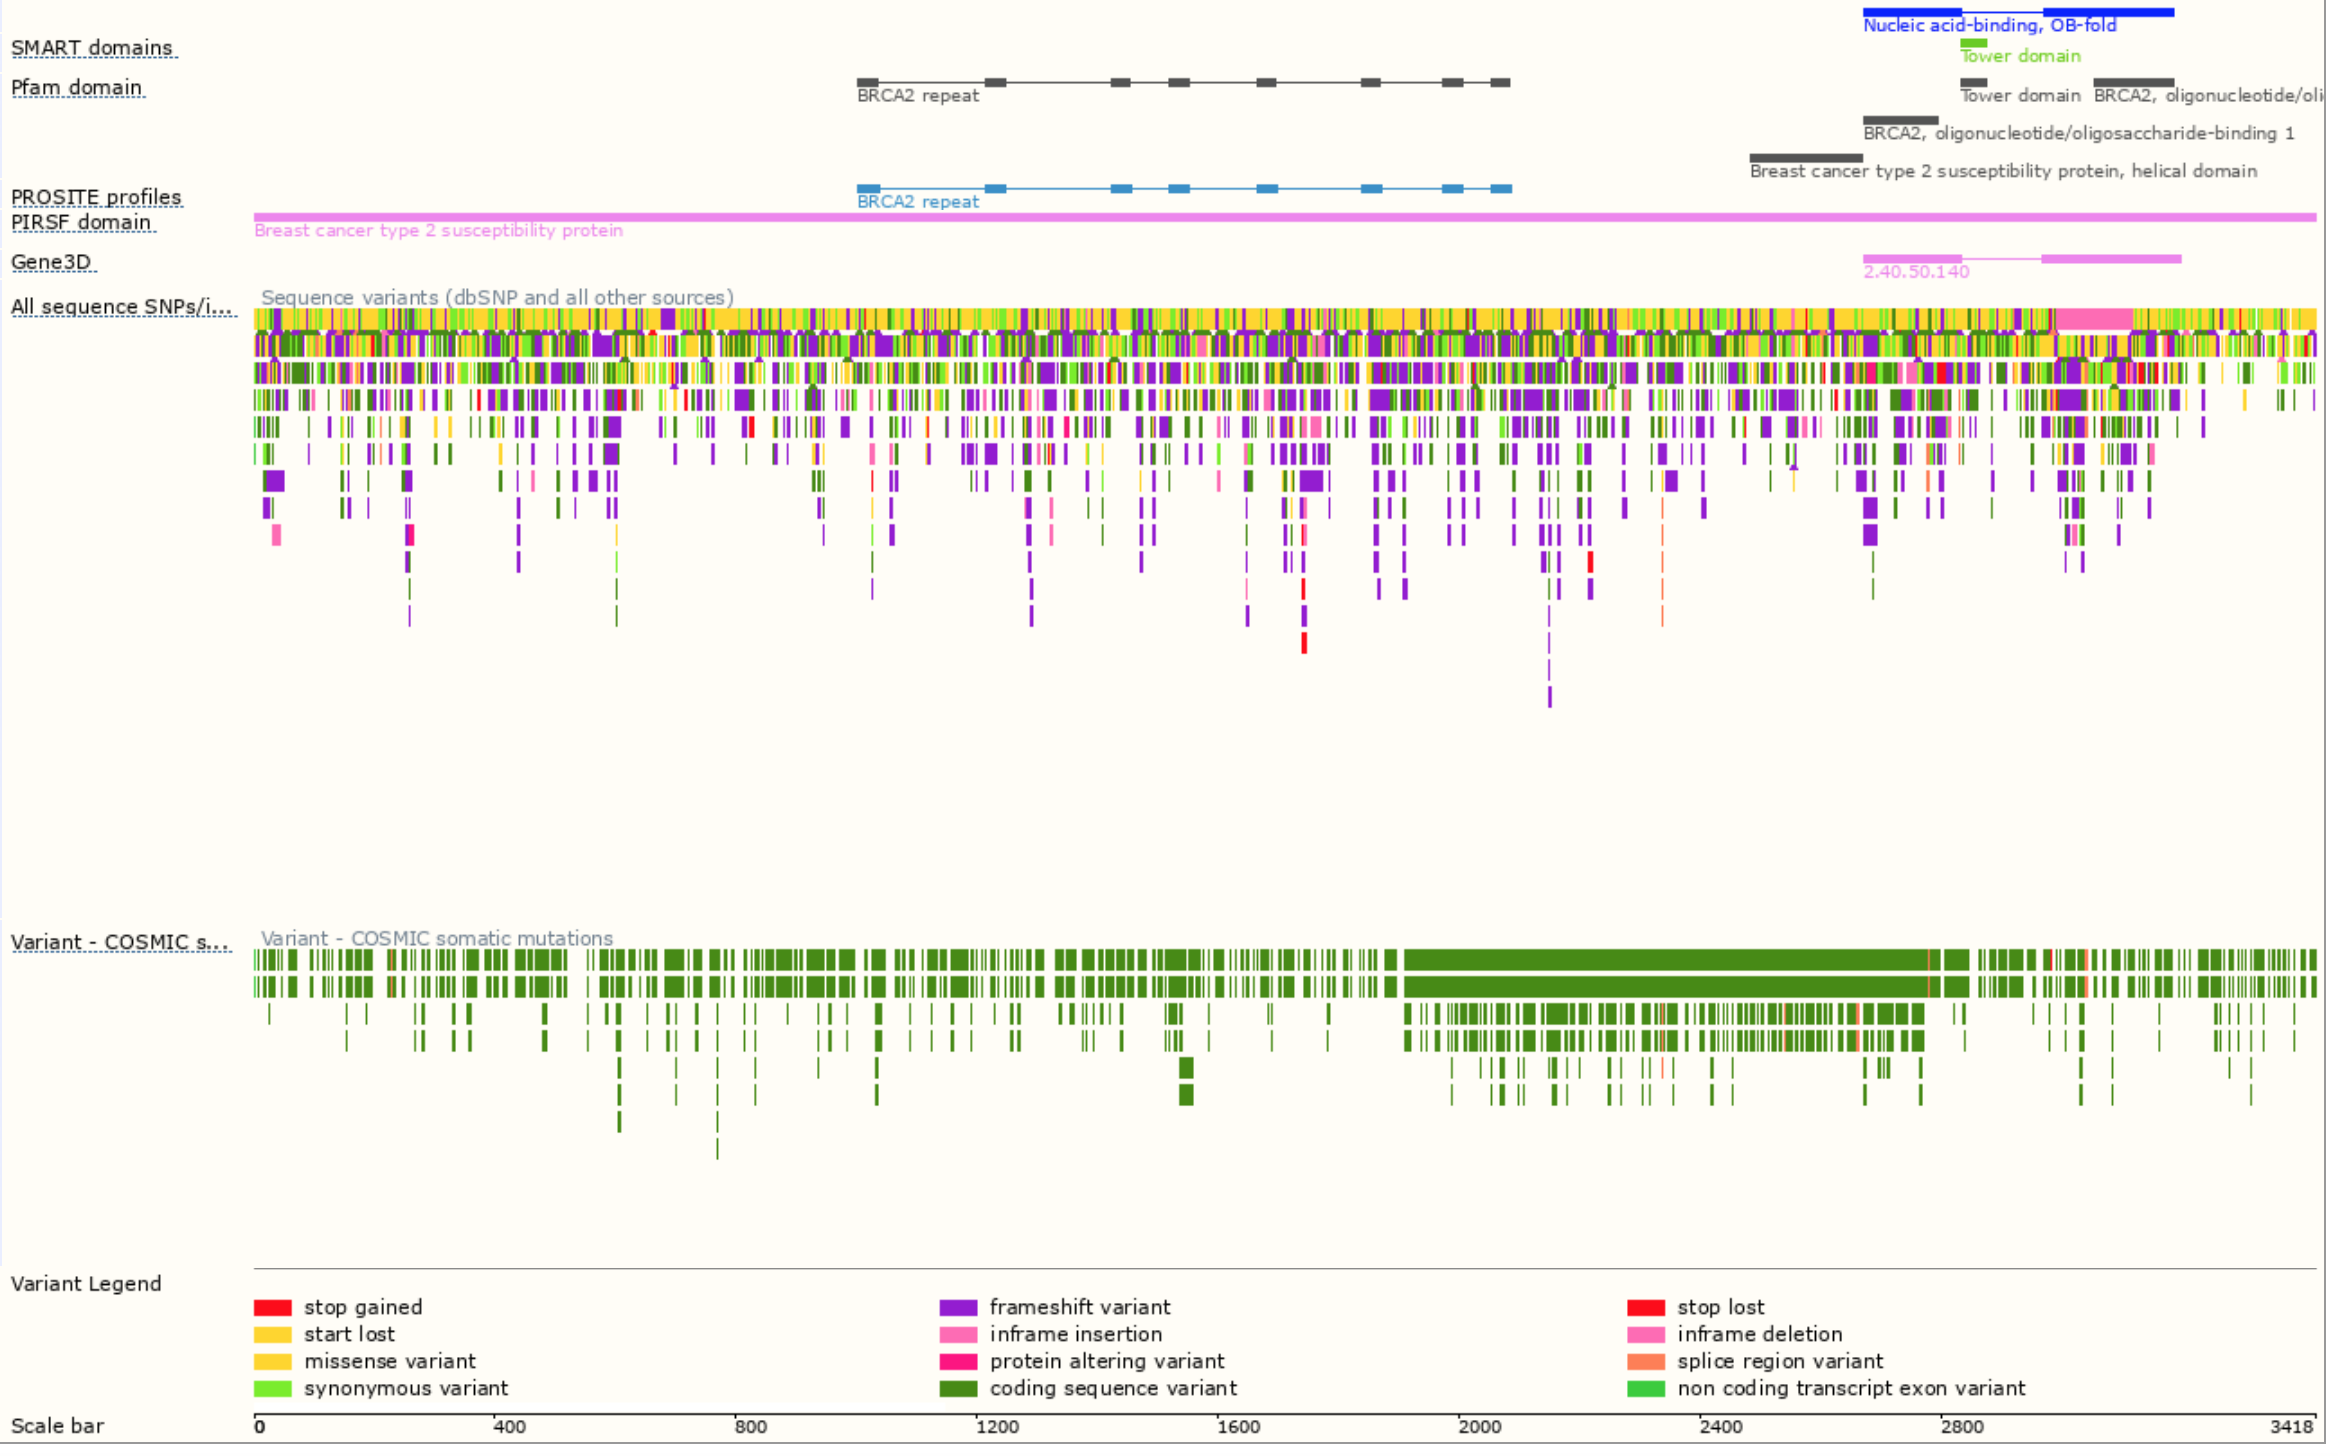
Ensembl database visualization of proteins: https://www.ensembl.org/Homo_sapiens/Transcript/ProteinSummary?db=core;g=ENSG00000139618;r=13:32315474-32400266;t=ENST00000380152
Coming up with a solution
Because the design team was facing a complex problem and in a field where we did not have much knowledge, such as biological data, it was necessary to conduct a series of interviews with users of the current database to determine the information needs they had and how the interaction with the tool was being done.
The design process started with sketches to decide which way we could represent the protein’s data using different visualization paradigms. After the research and the brainstorming processes, we designed the following layout for the visualization tool to use it in the implementation process.
Three proposals were made in Adobe Illustrator with fake data which were given to the same users (researchers and specialist in the matter) who participated in the interviews in the previous design phase, they were in charge of validating them and choosing which of the three proposals best suited to the information needs.After all the research and the brainstorming processes, the team chooses the linear layout for the visualization tool in order to be used it in the implementation process.

Sketching process

Illustrator static prototype with fake data
The result
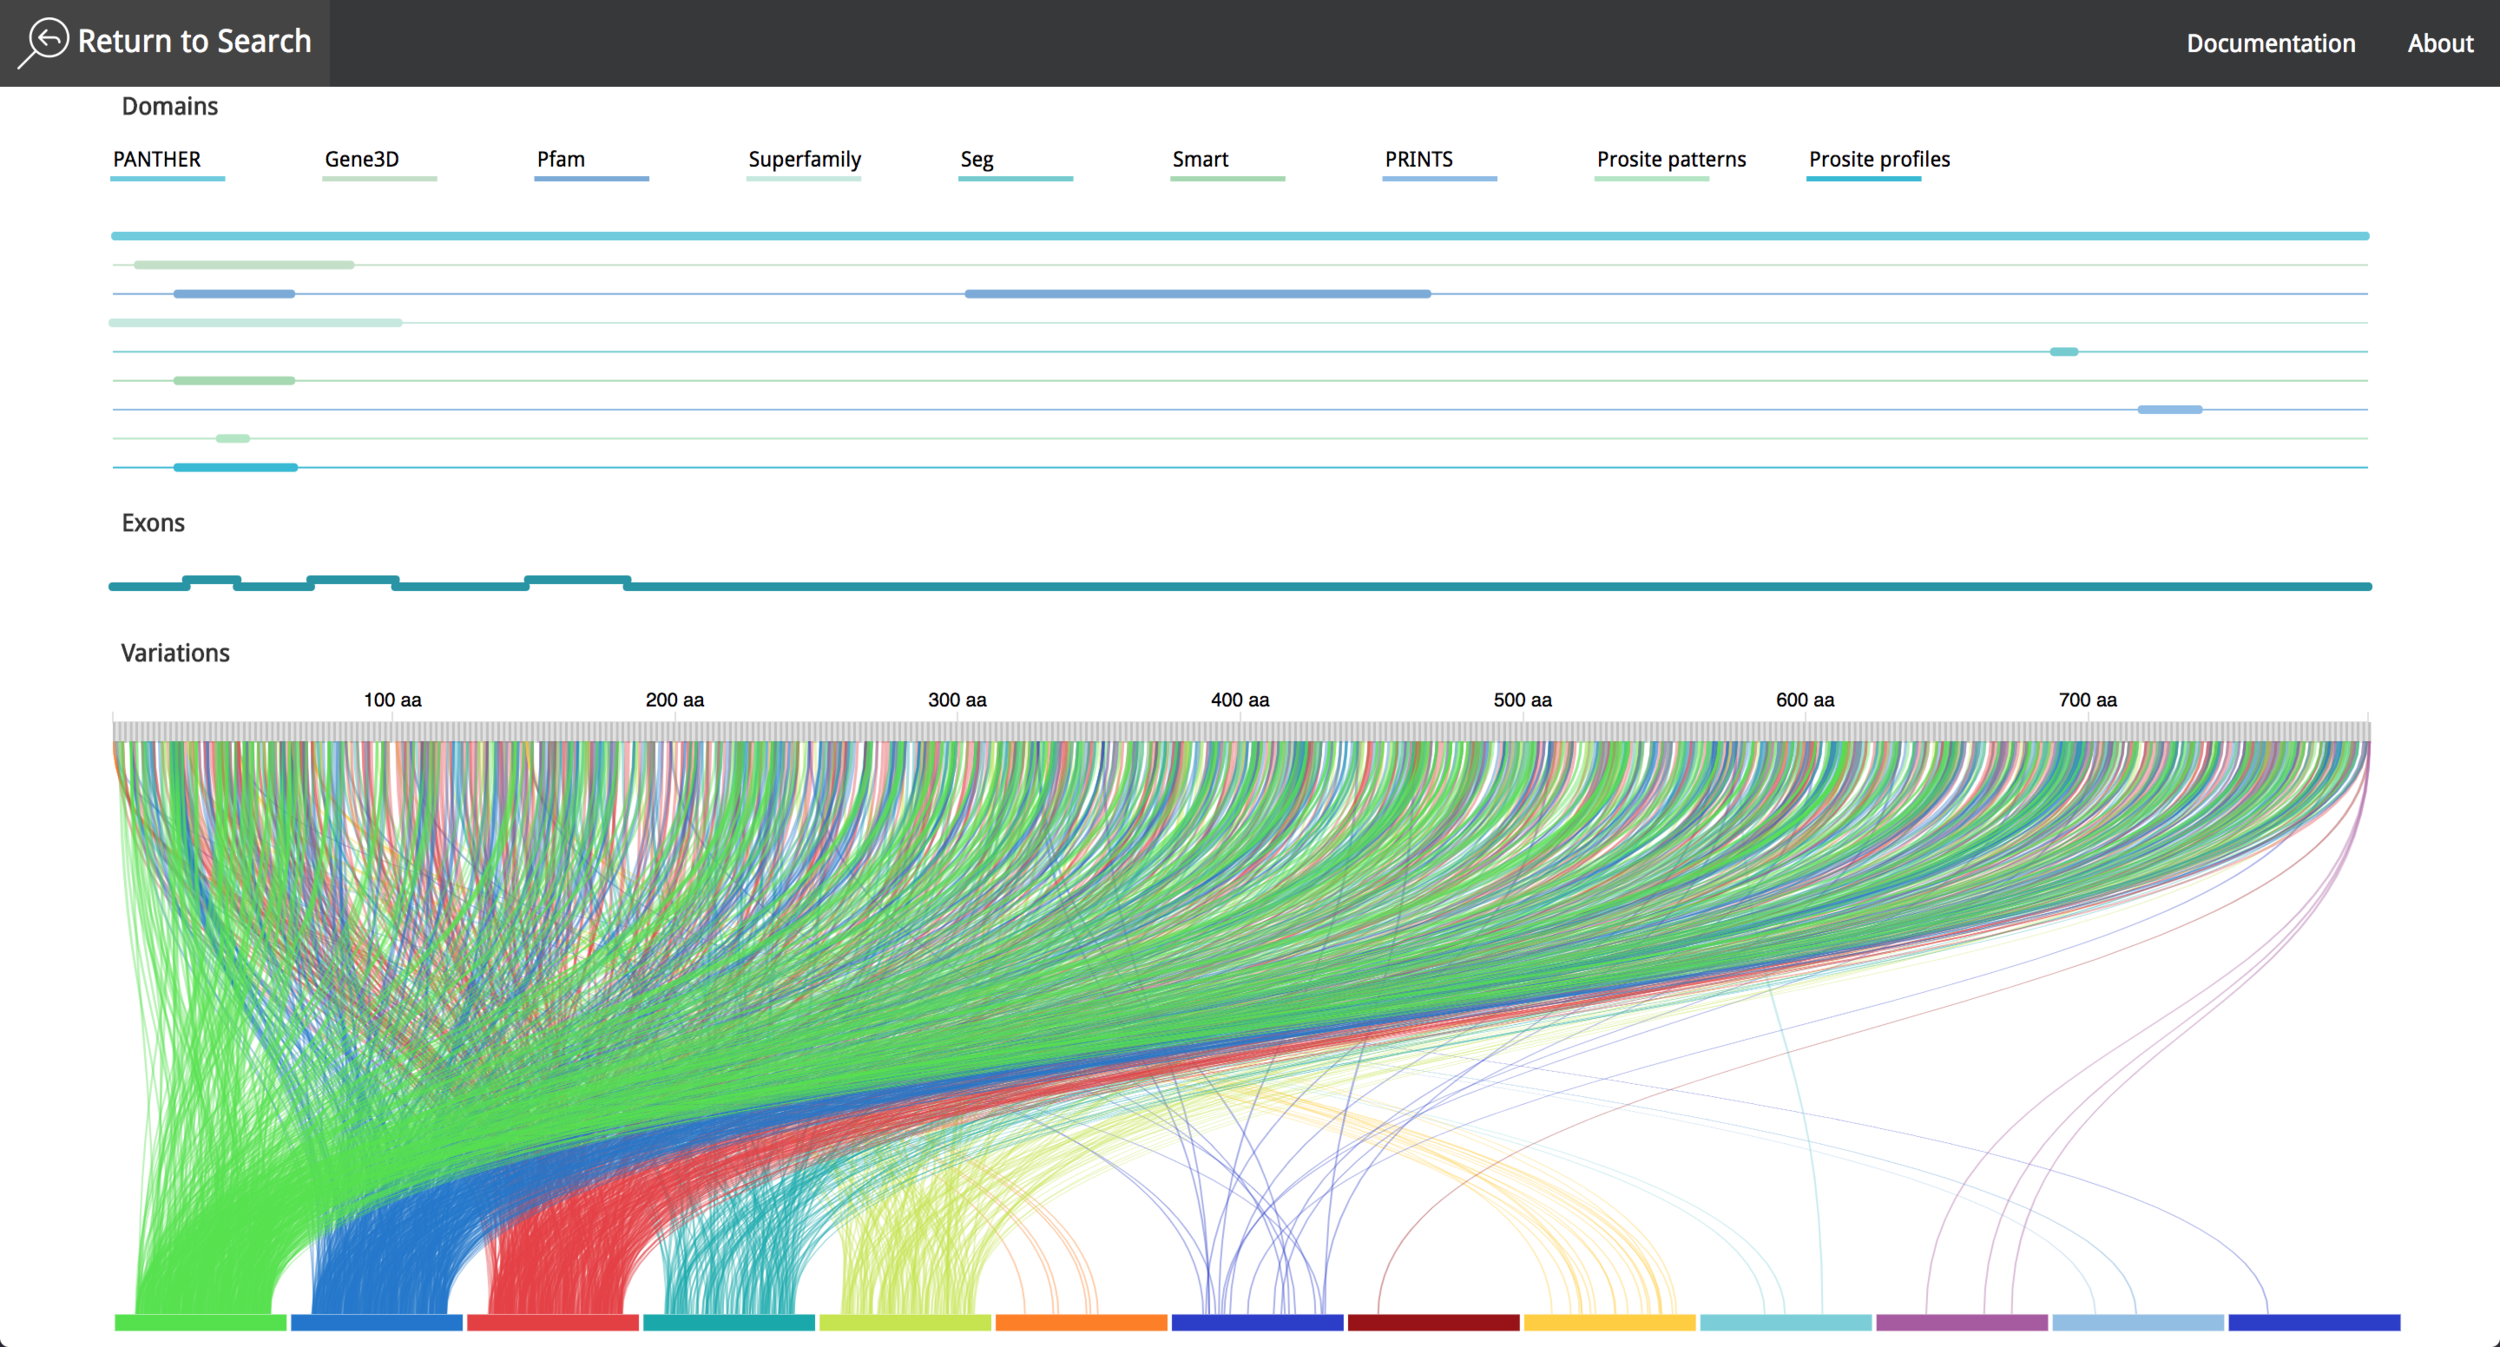
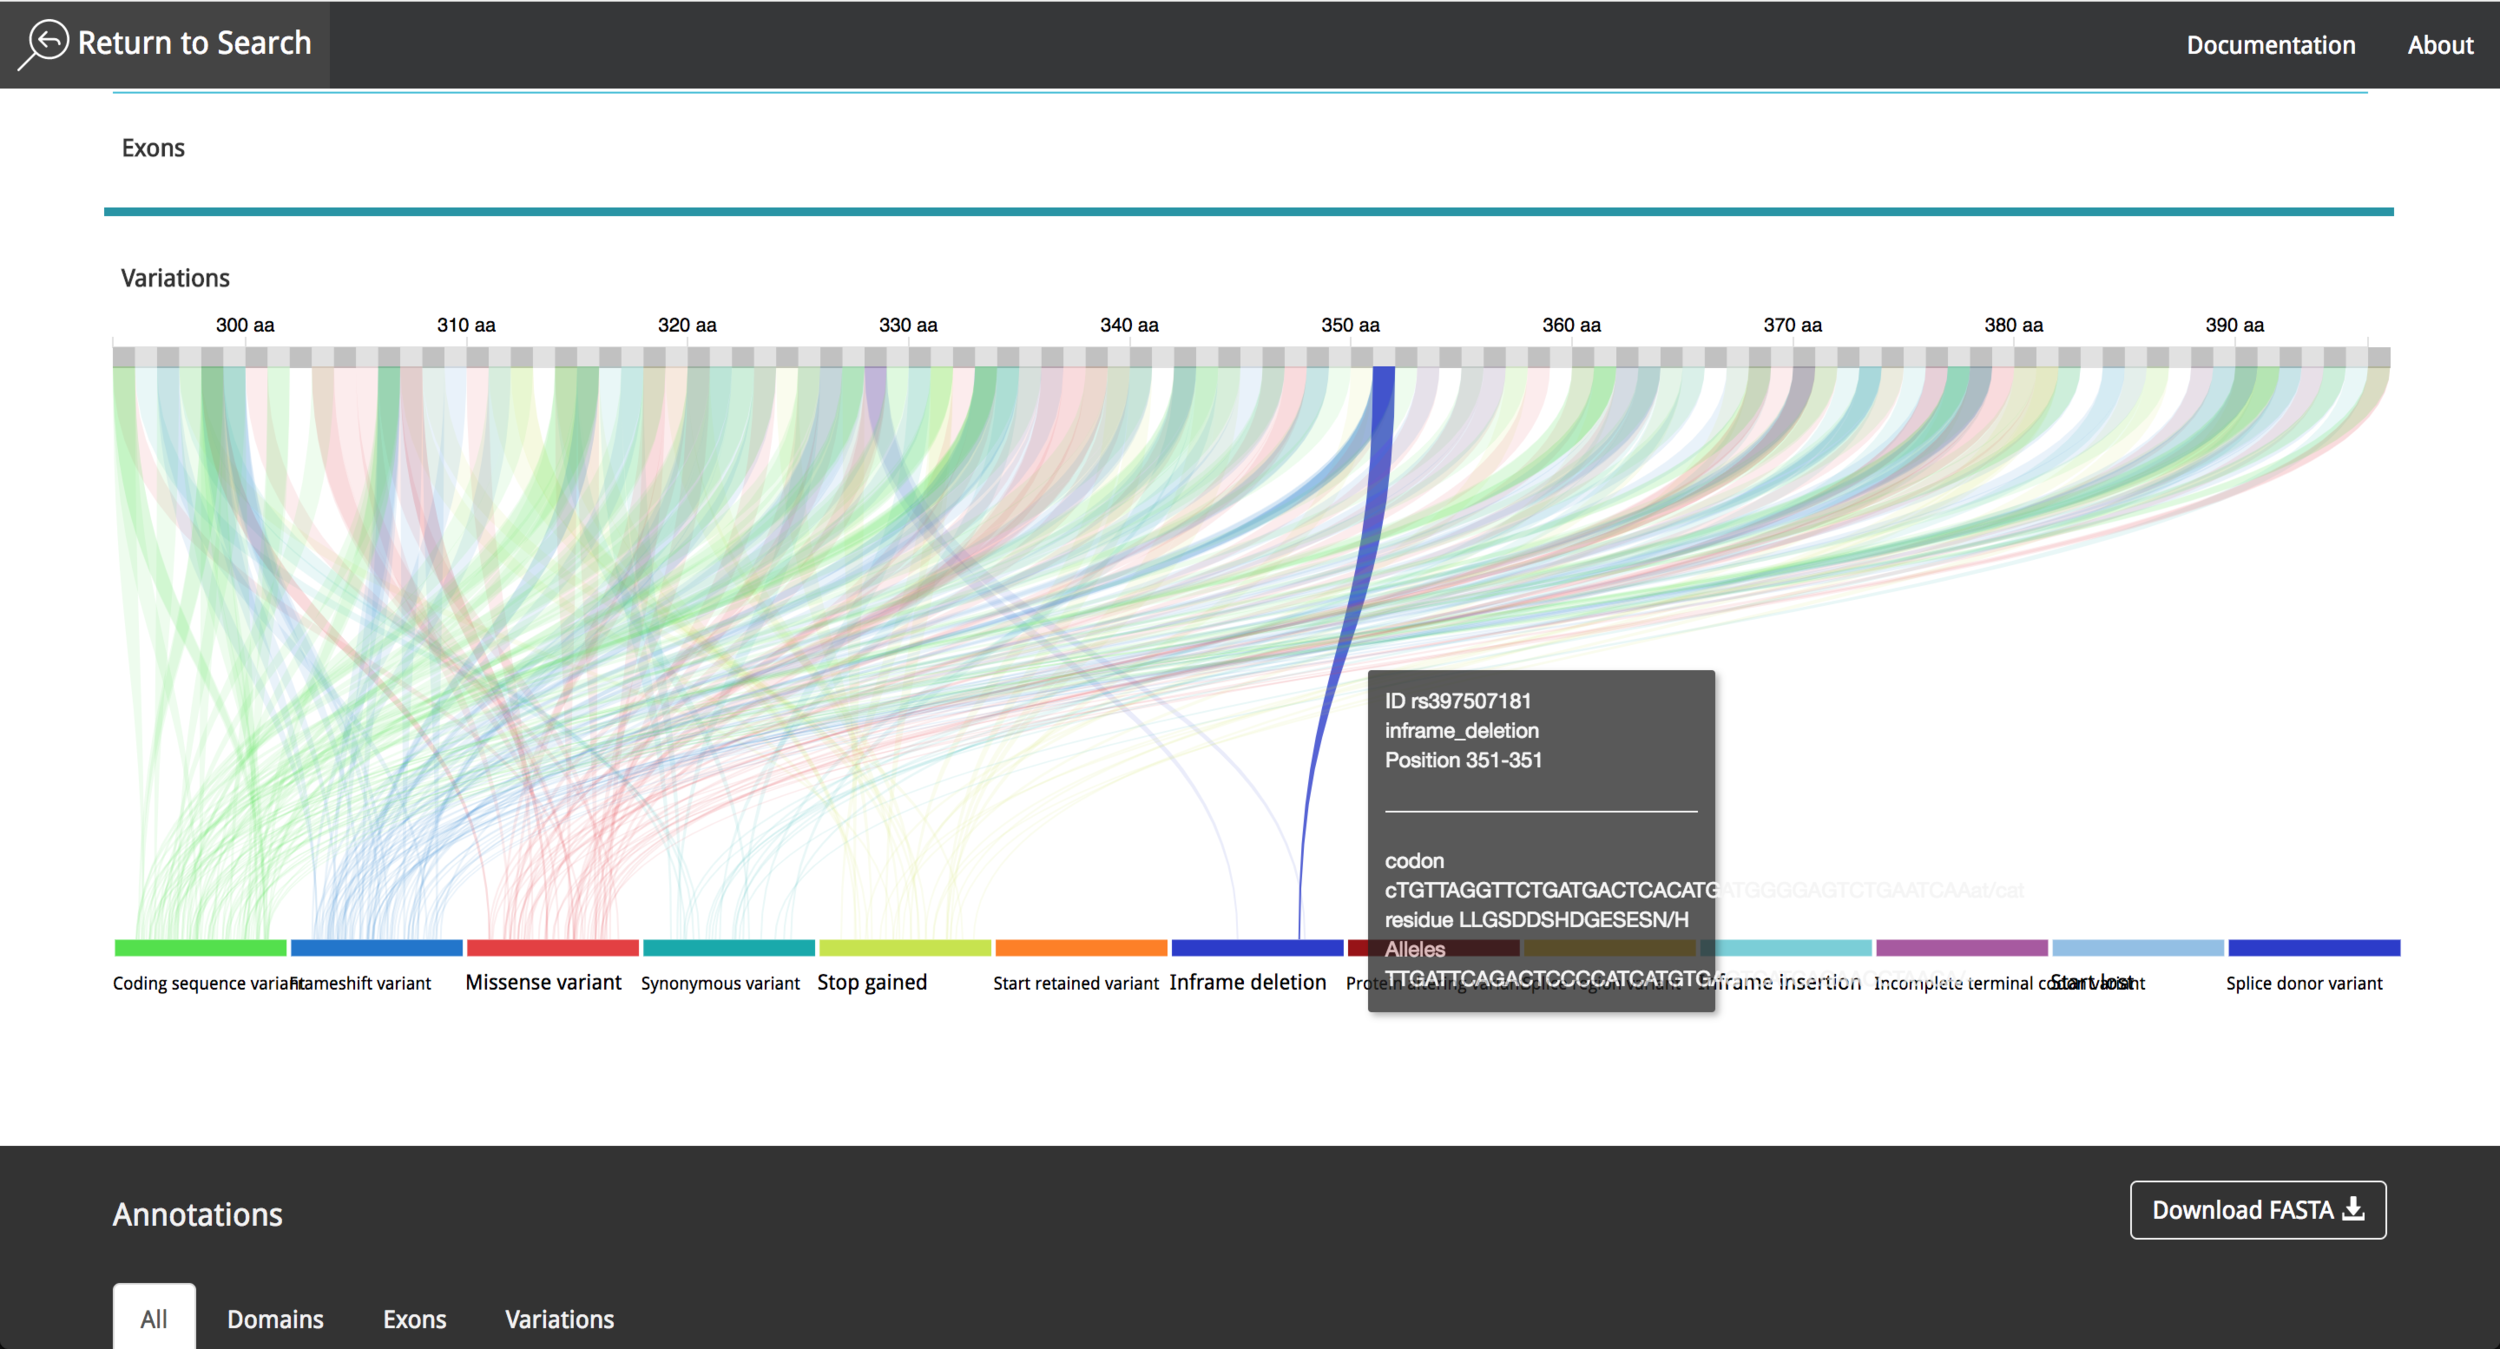
VizGVar is a highly interactive, web-based visualization of Ensembl genetic variations, accessible at http://vizport.io/vizgvar. The VizGVar web application was developed using JavaScript, HTML5, and CSS. In order to enable interactivity and a fast data update processes, the modern data handling library d3.js (https://d3js.org ) was used. To query data from the Ensembl API, and for styling and object animations JQuery (https://jquery.com/ ) was implemented.
Demo of the state of the project in 2016. Credits to Antonio Solano.
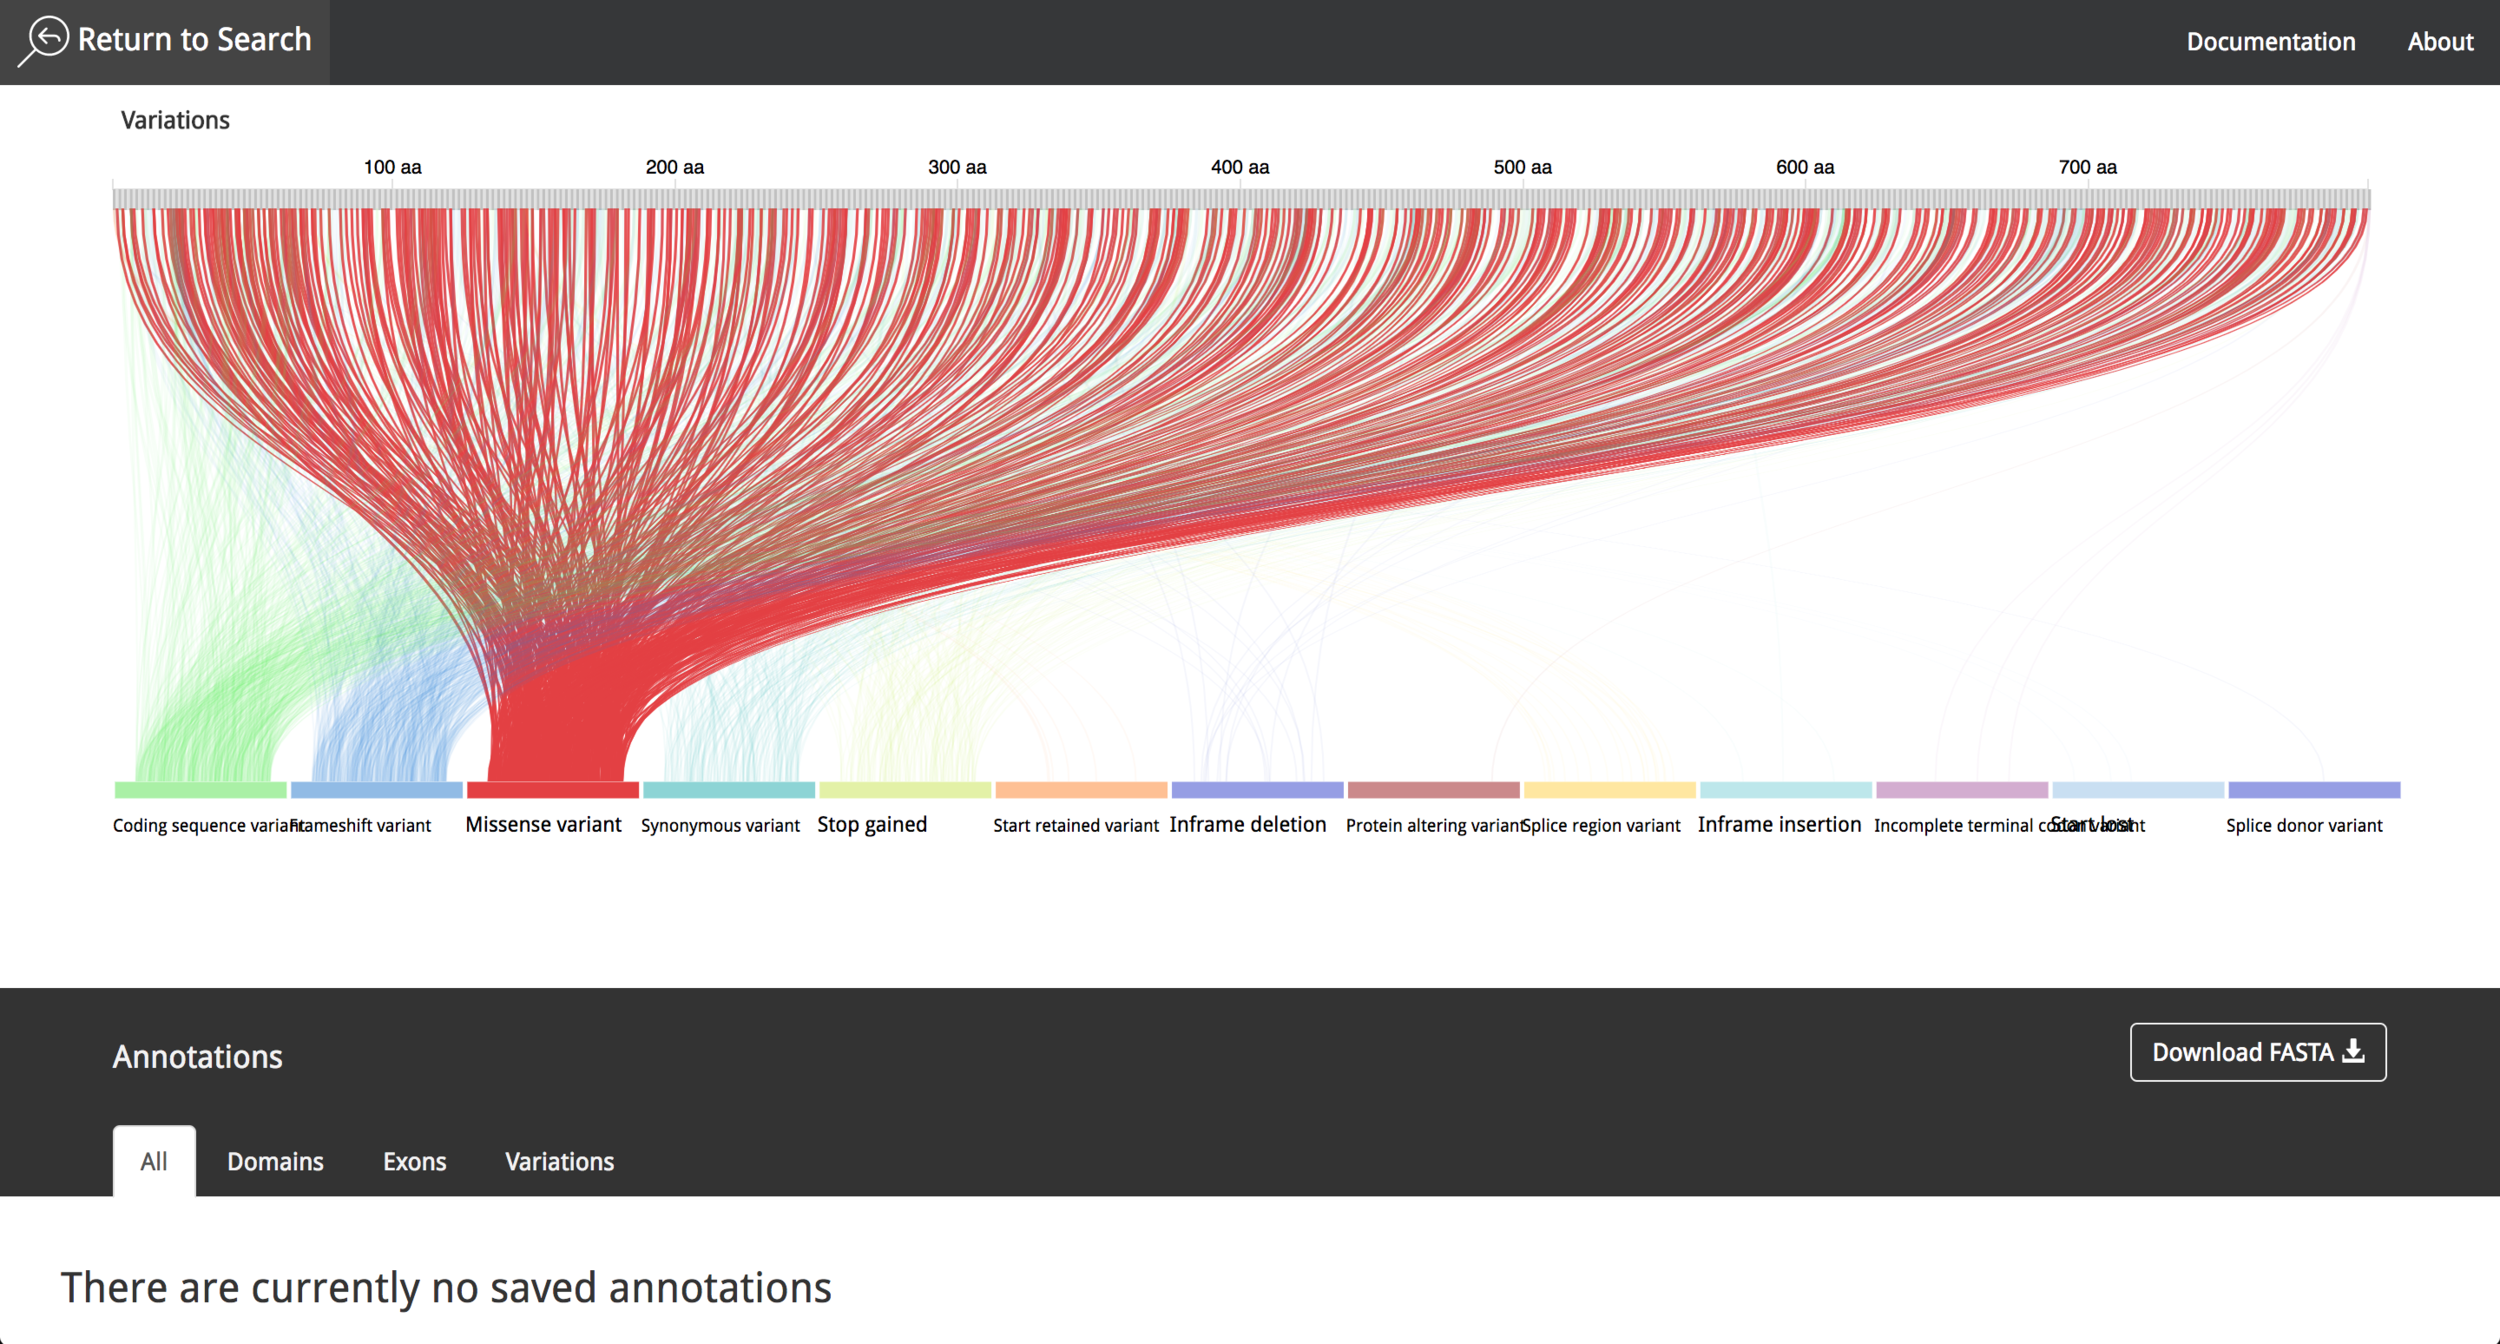
After the implementation process, the result was a simple layout, which facilitates the process to obtain information from the data contained in the visualization tool. The data comes from Ensembl Database (https://www.ensembl.org/index.html) part of The European Bioinformatics Institute (EMBL-EBI) (https://www.ebi.ac.uk/ ) which gives the system a high level of credibility and trust due to the data source quality and the fast update of research findings. The visualization tool is responsive, and can also be used in mobile devices, to make it easier for research teams to investigate the features of a given protein.
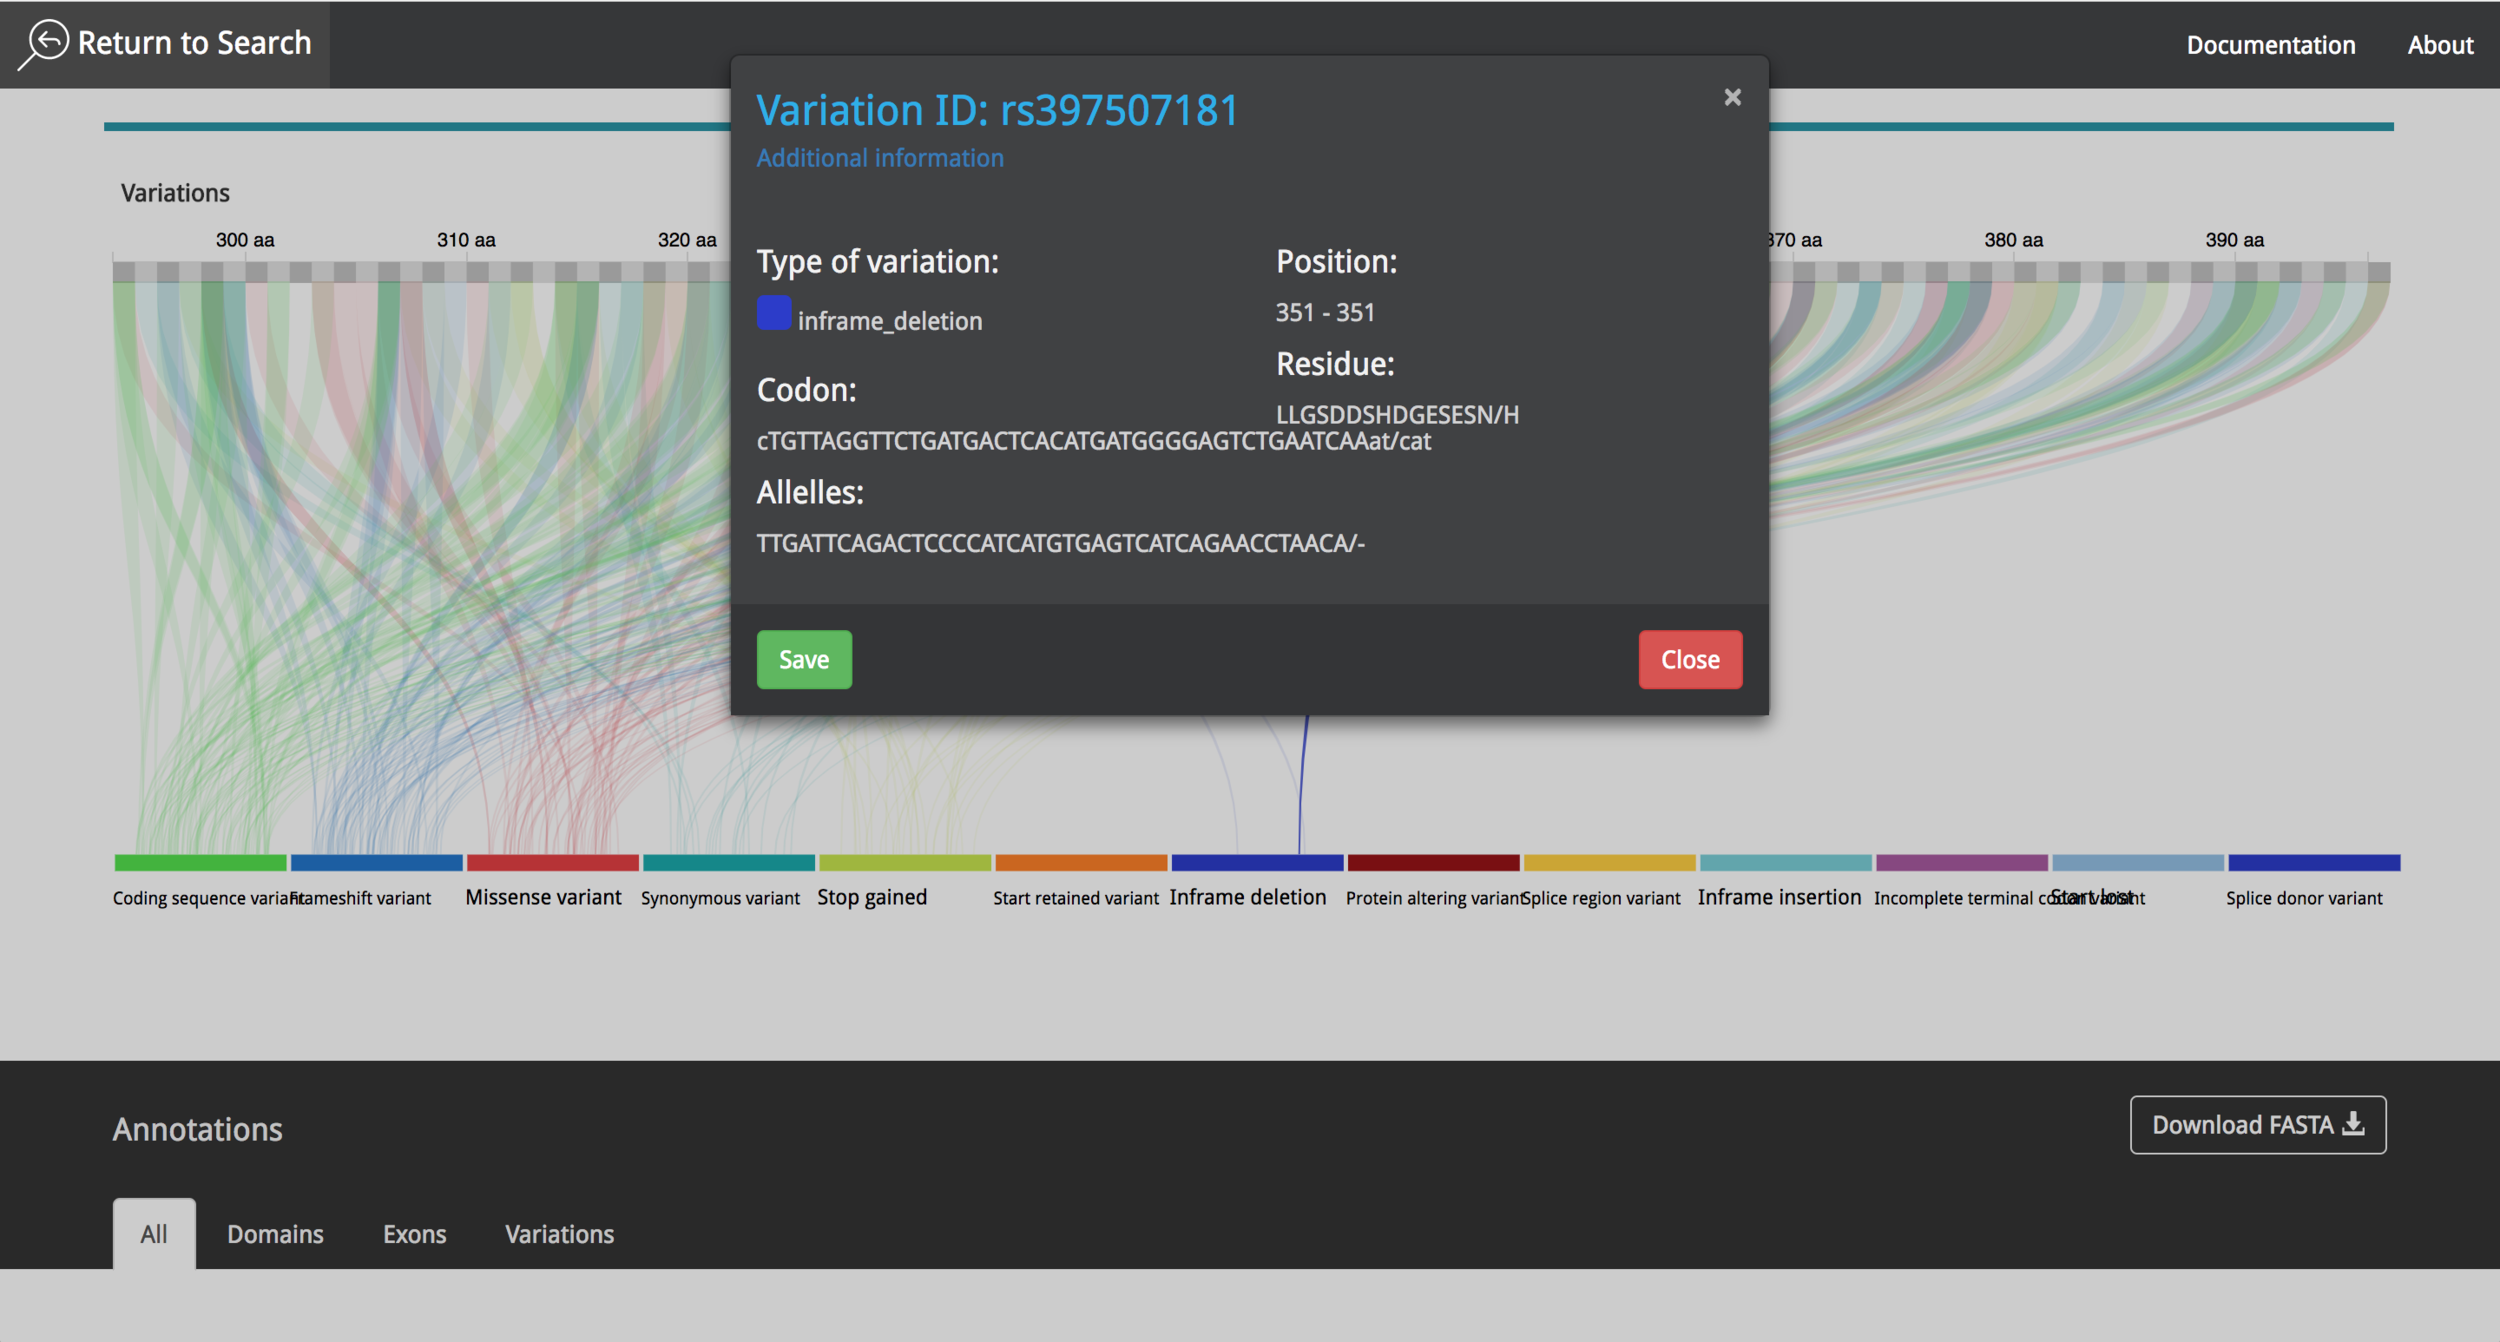
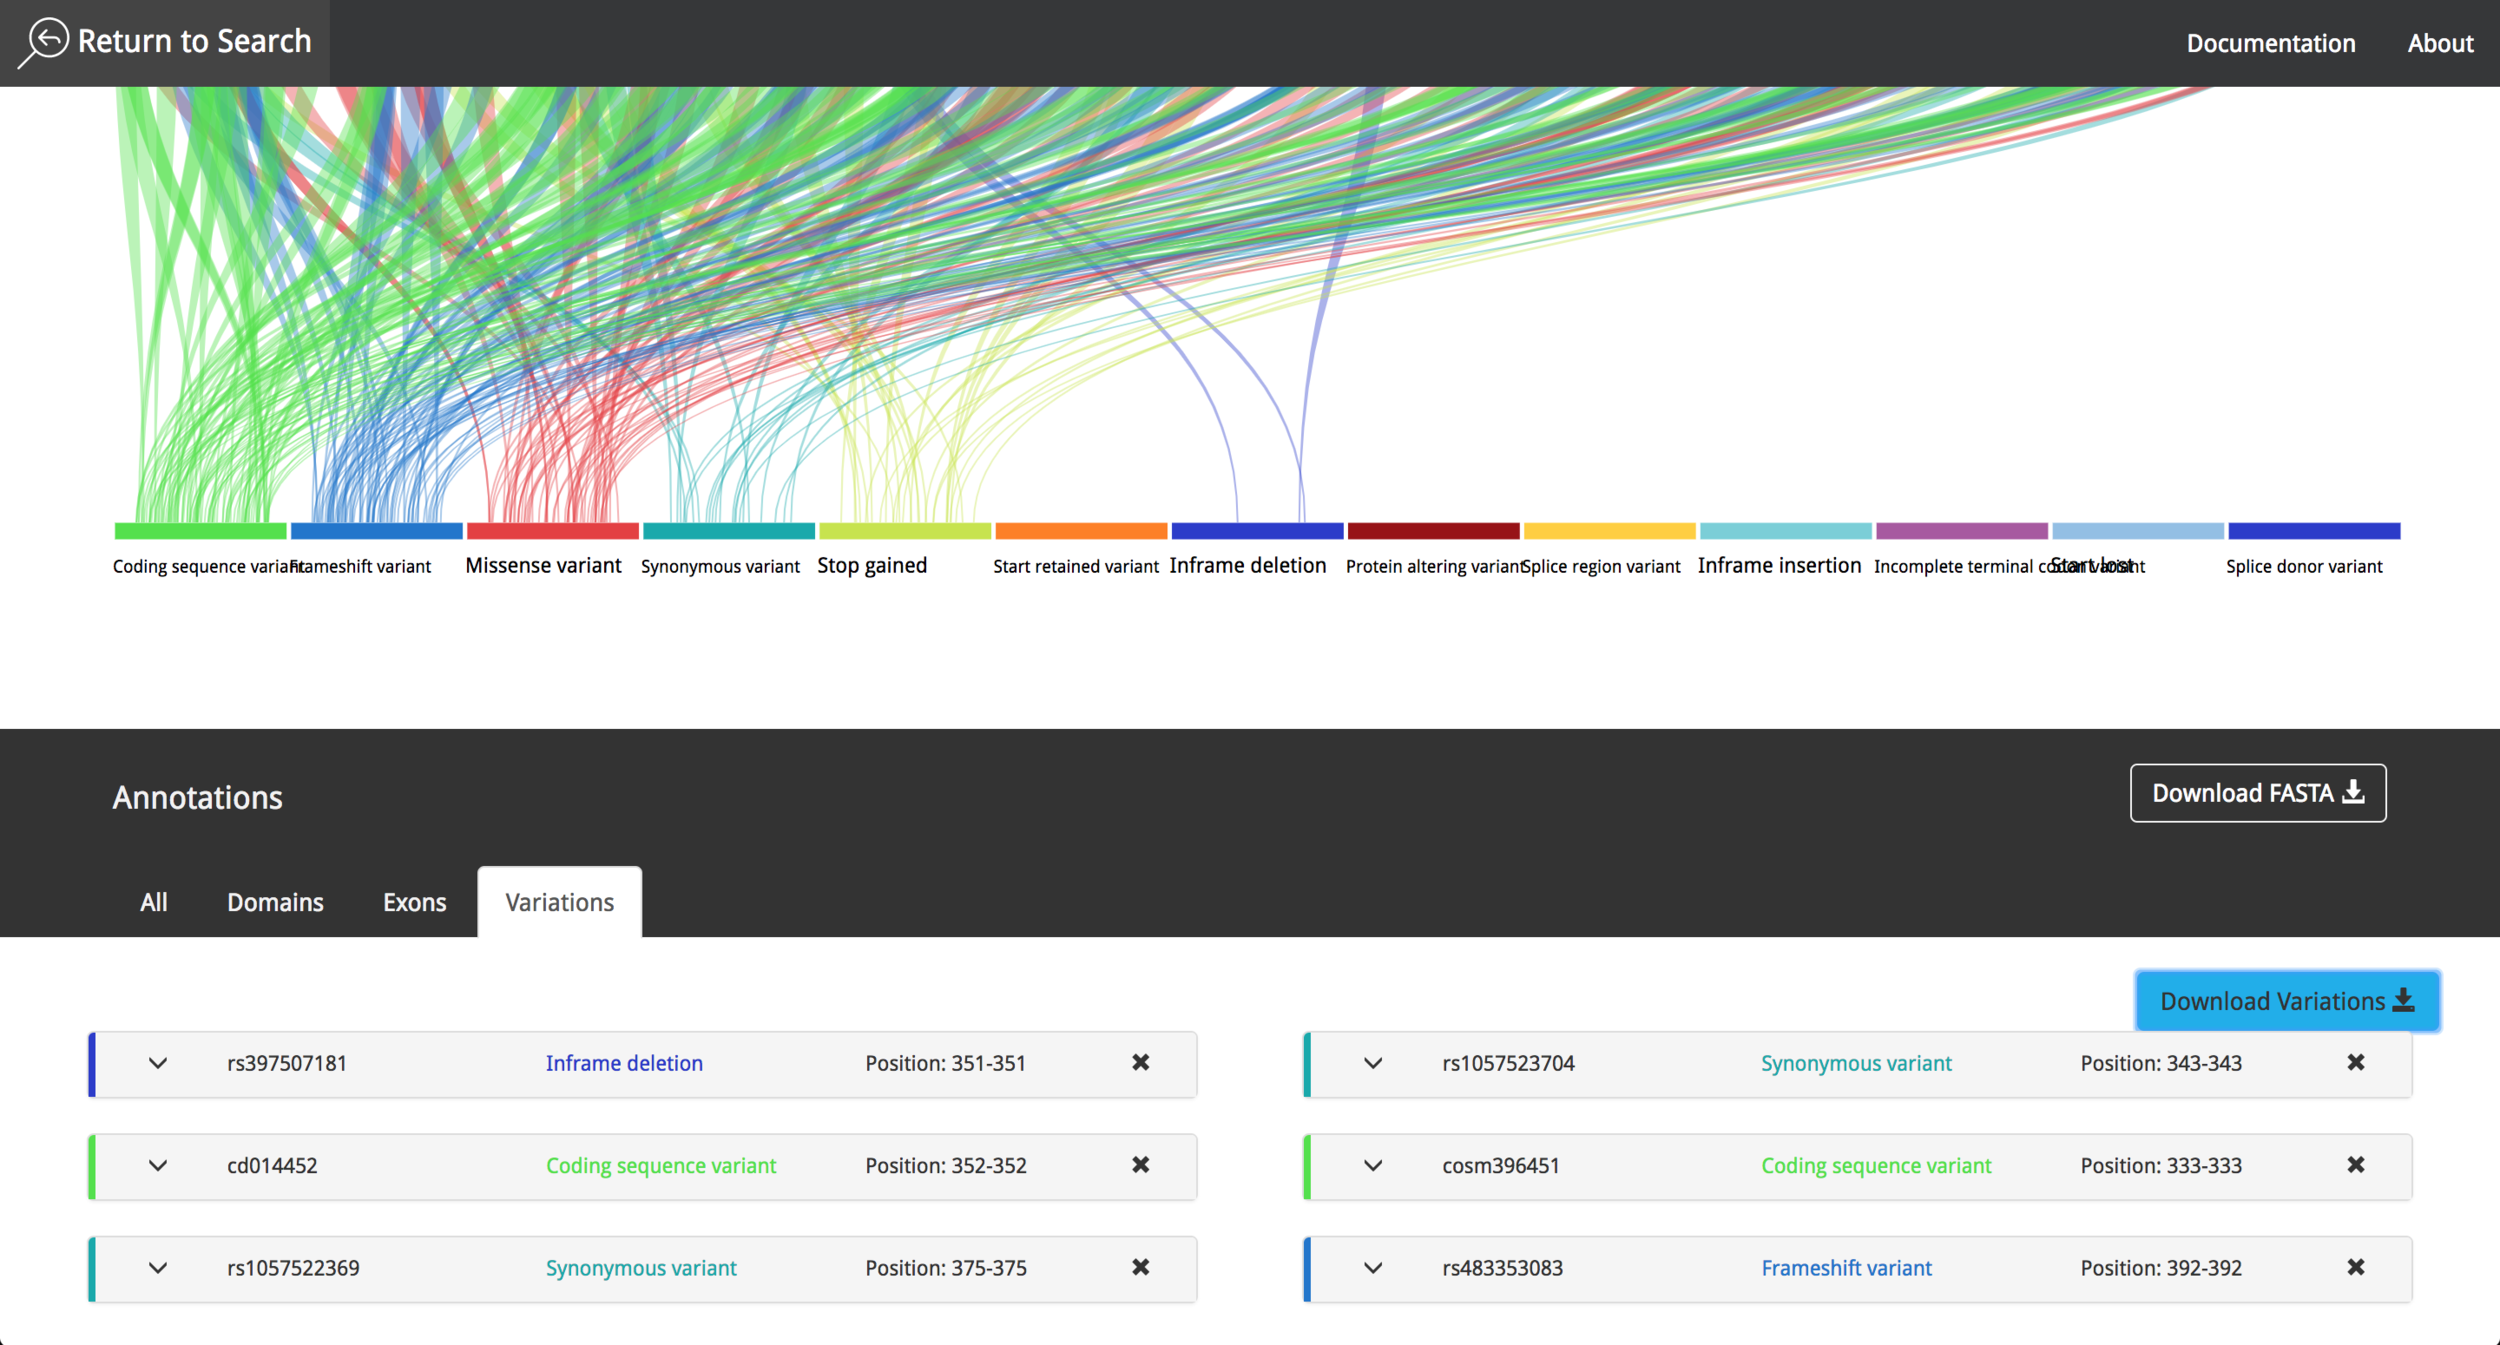
It is possible to choose between different proteins, interact with the data and get information using "mouse-over" events. The user can save the annotations during the research process and export them afterwards as a .csv file. The video in the following link shows the current state of the project and all the new functionalities that where implemented in 2016.
The project was presented in the first World Usability Day in Costa Rica, which was celebrated on November 2015. VizPort continued under development and its name was later changed to Visualization portal for genetic variation (VizGVar).
The project was also mentioned in the following publications:

Copyright:
Verónica Alfaro, Carlos Cruz, Antonio Solano
Mentoring: Ph.D. Franklin Hernández, Ph.D. Allan Orozco
Design Engineering BA, 2014, TEC