Space Utilization Dashboard
The Space Utilization Dashboard was requested as an effort to understand how do people from the company used the spaces, which schedules generated more conflicts for over utilization and how to prevent the under utilization and the financial consequences of not using the space efficiently.

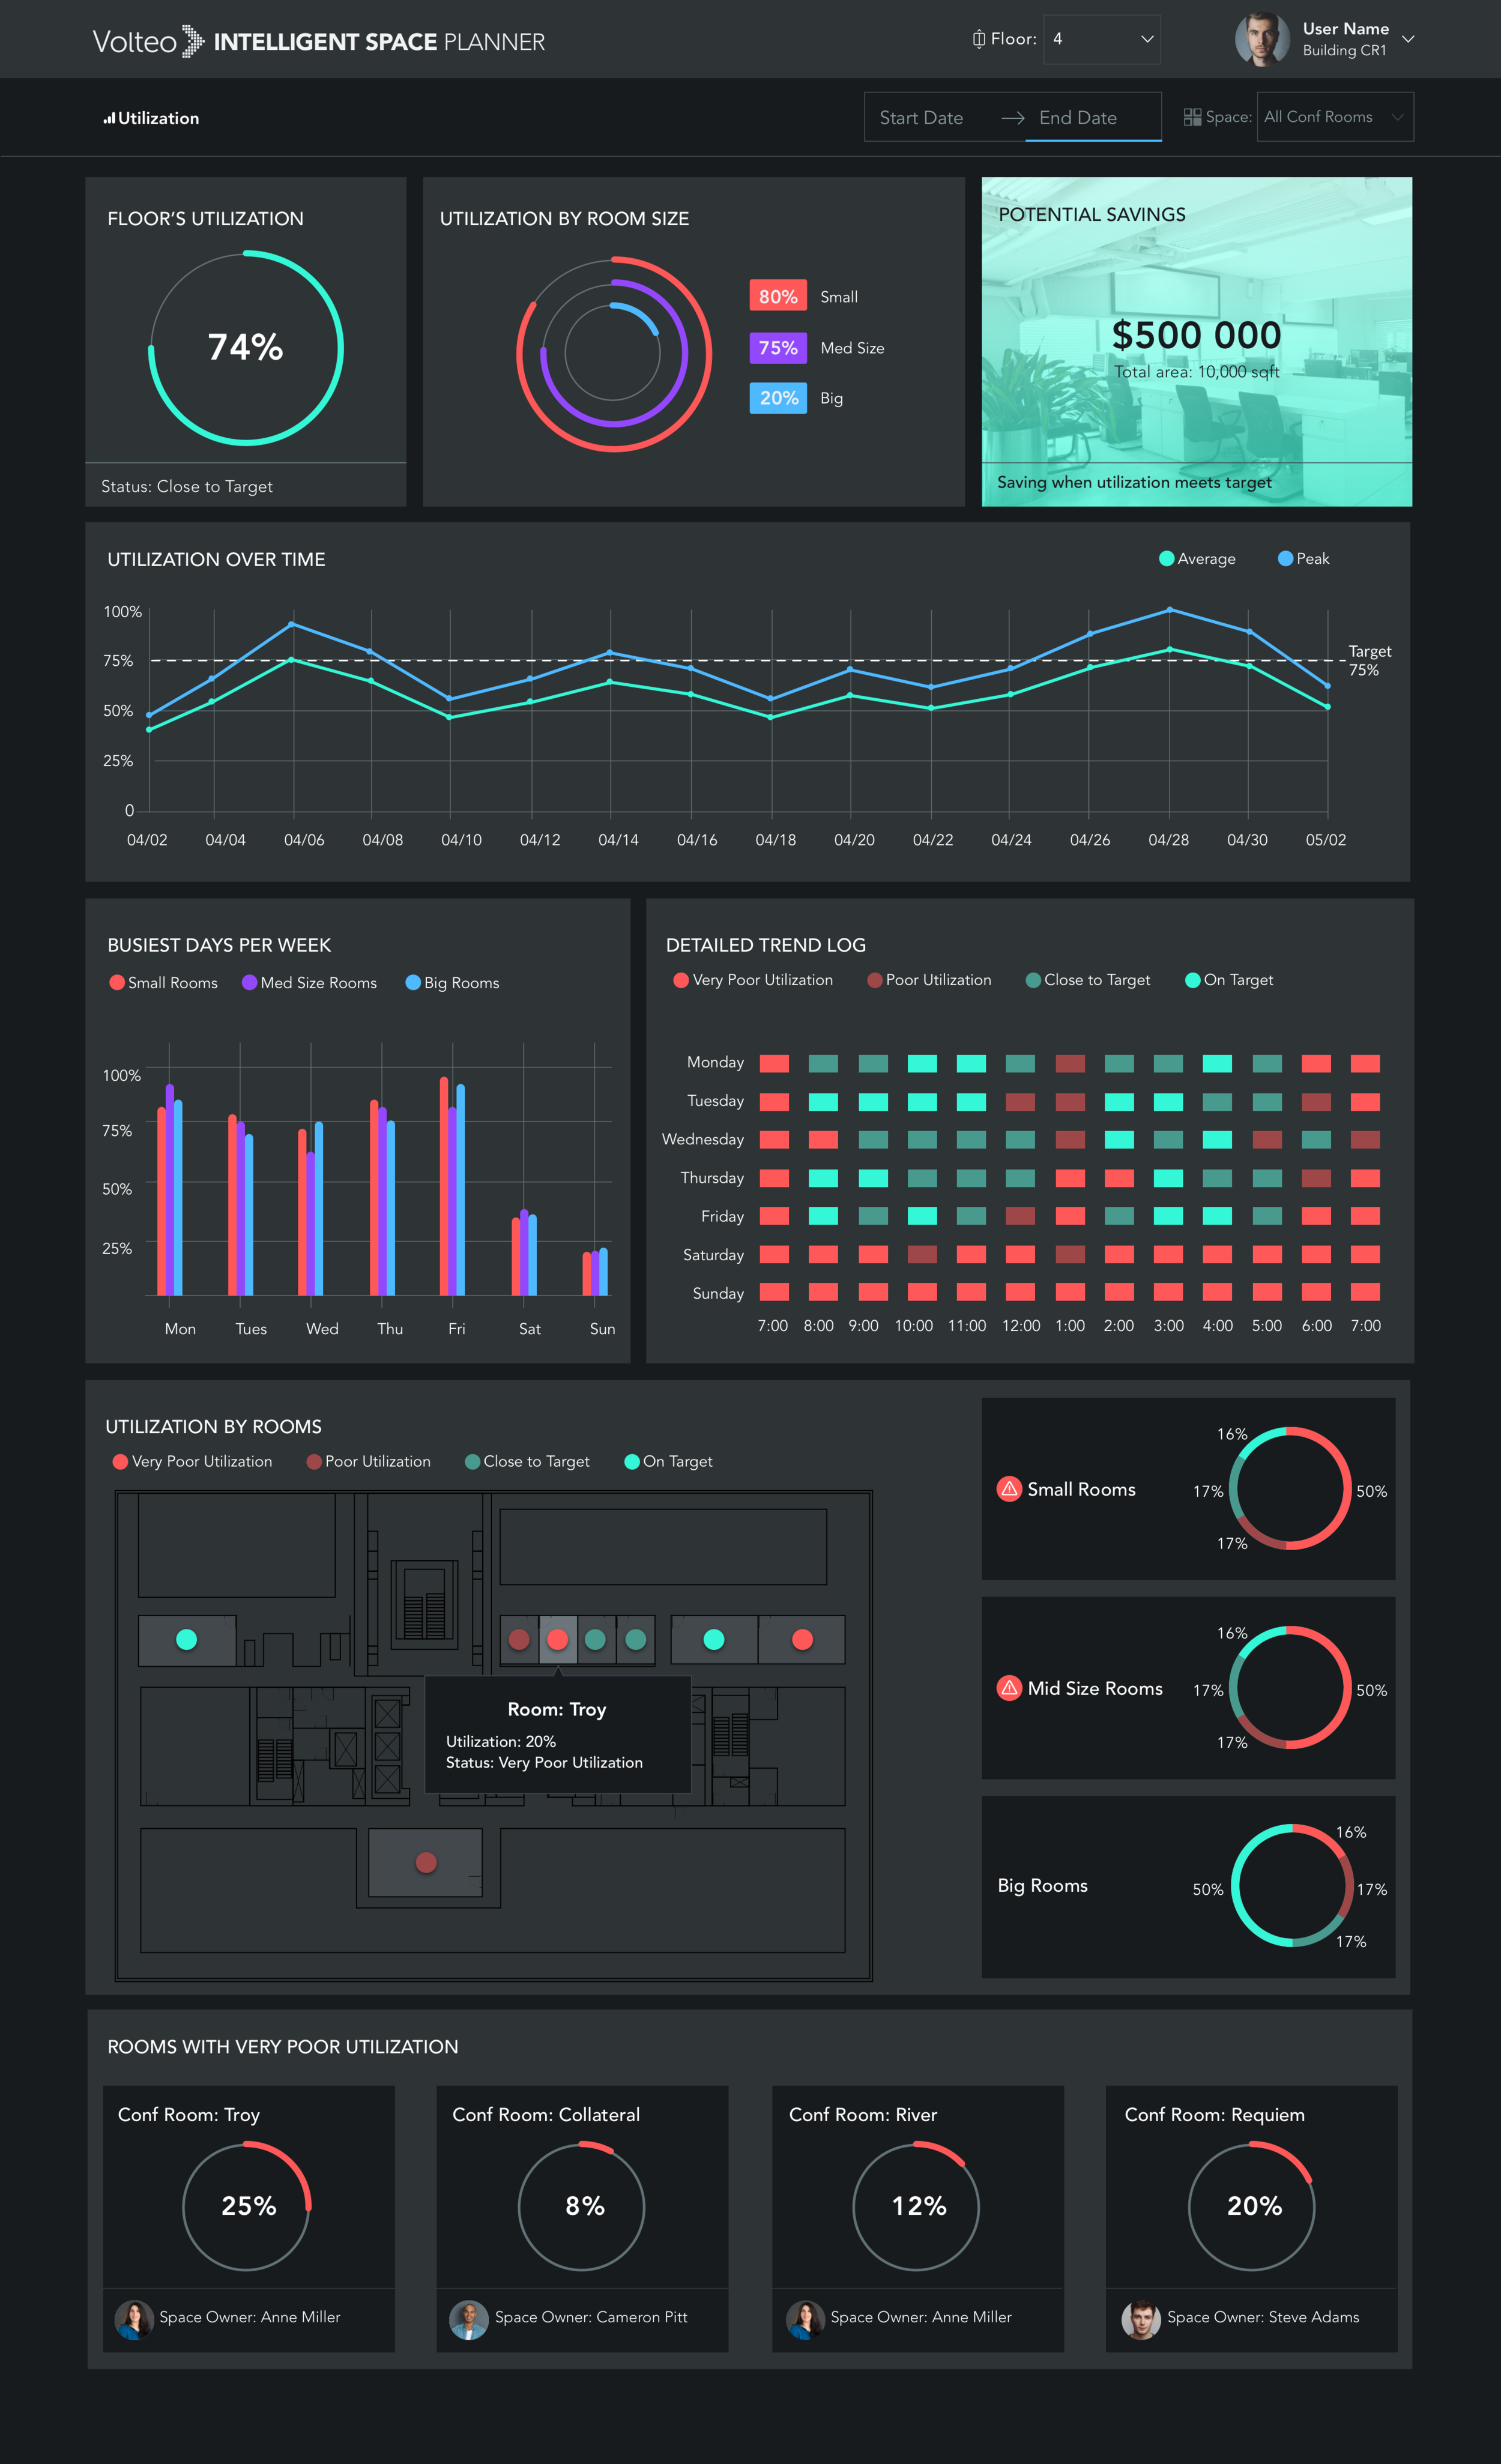
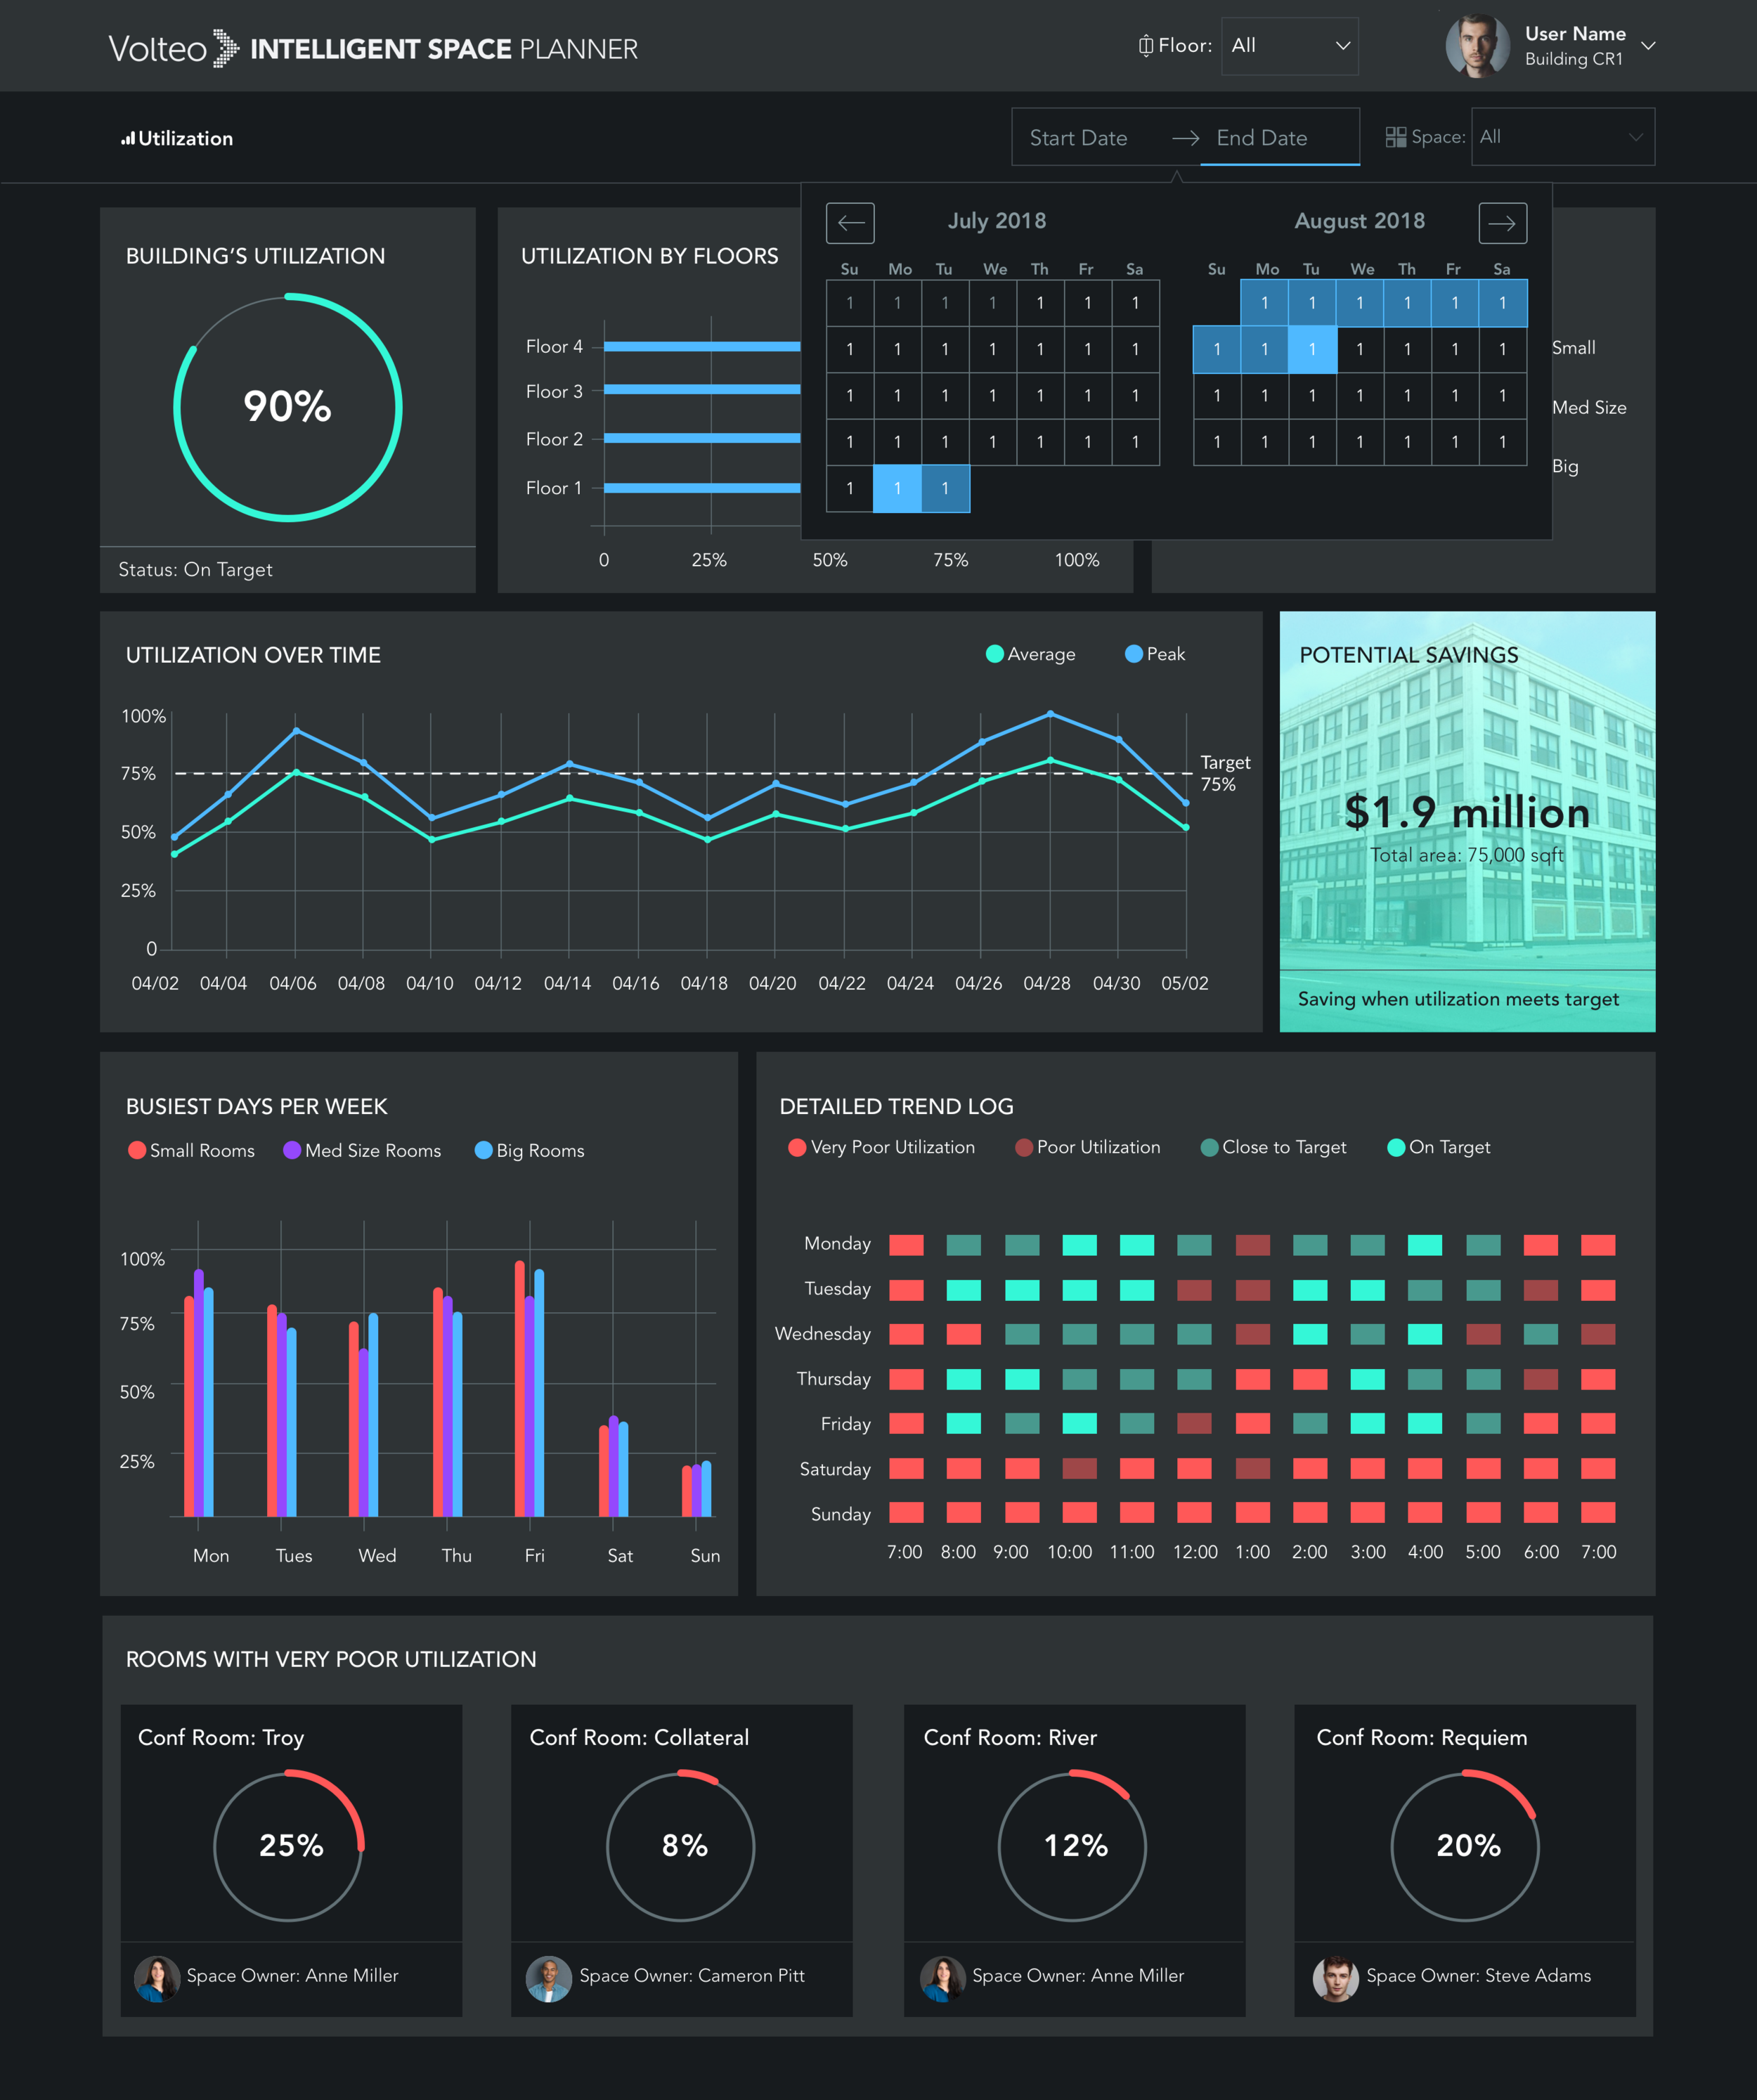
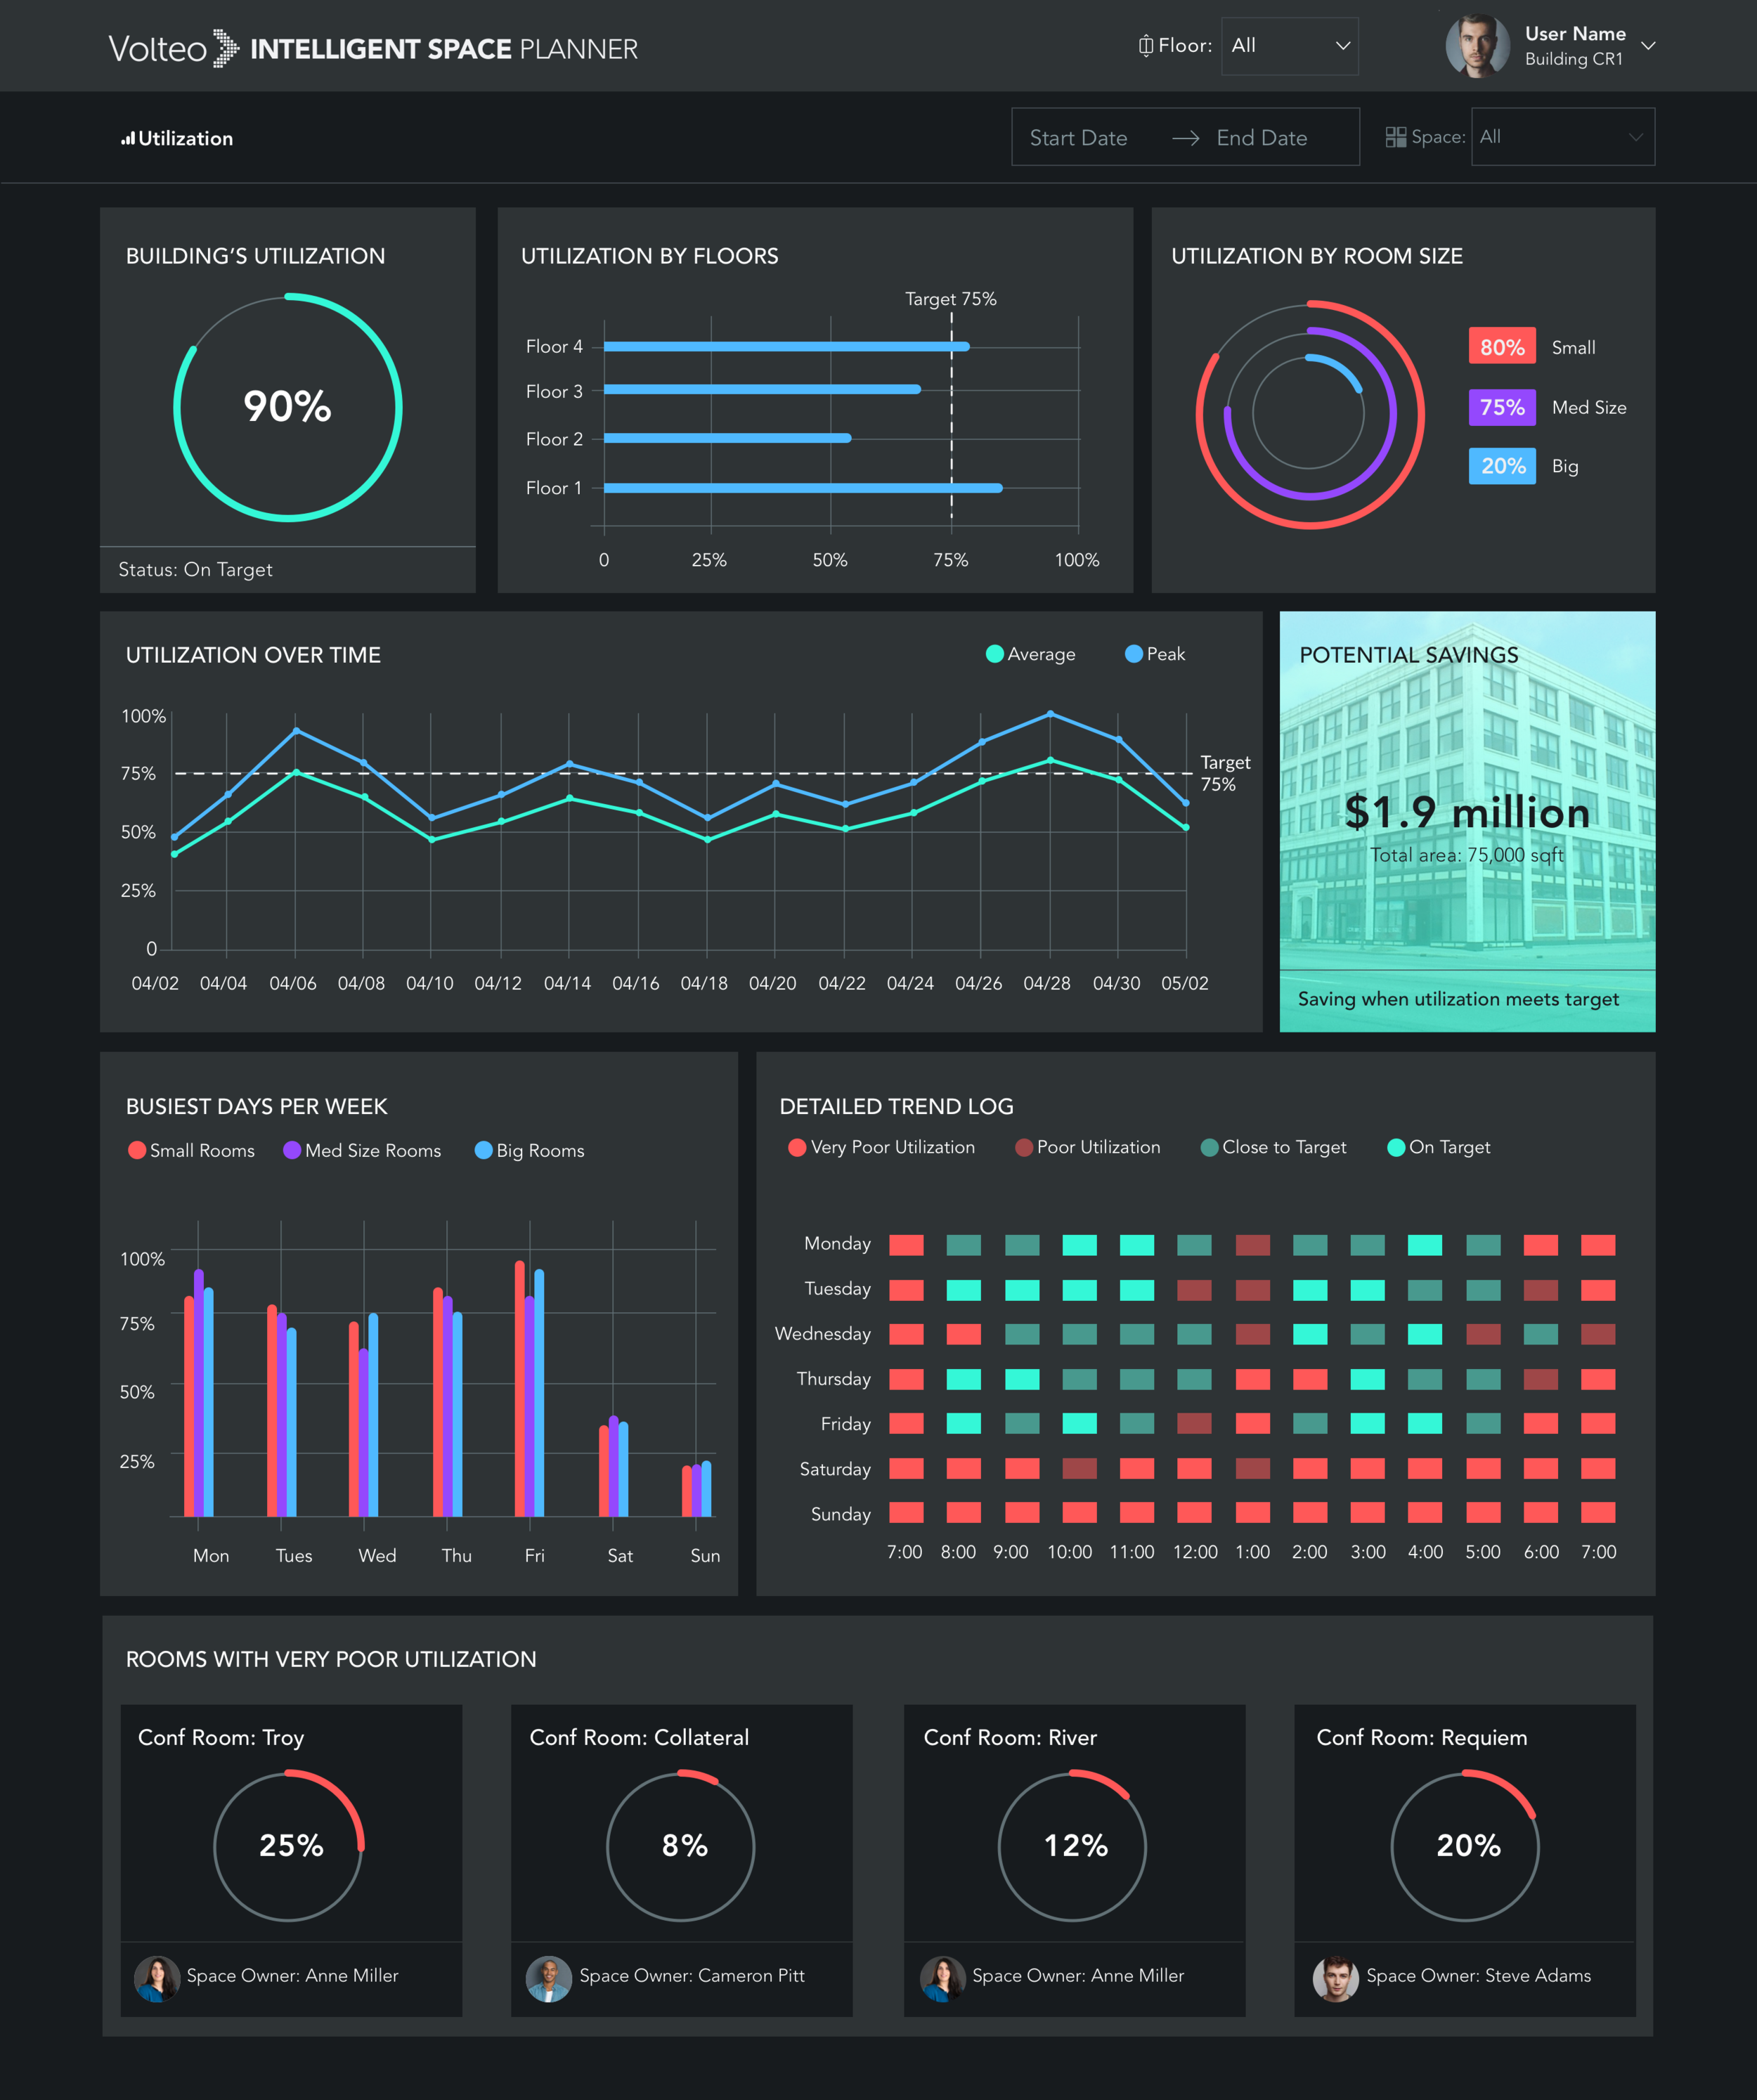
Final UI Design
The problem
As the company that requested the dashboard started growing in size and also the amount of workers, they started facing challenges about how to distribute the space efficiently so that the people would feel comfortable and have enough space to have meetings. The customer understood that the problem was the lack of data therefore the solution that Volteo proposed was to create an IoT Dashboard, that is going to be fed with data collected from sensors in the rooms.
Coming up with a solution
For this project was crucial to meet with the customer in order to understand their requirements from the data collection perspective and later on from the User Experience perspective. Since the collection of the data is directly related to the dashboard functionalities it was very important that me as designer was involved since the beginning of the project.
The sketching and wireframing phases were of big help to be able to communicate more clearly with the customer, once they could interact with an InVision prototype it was easier to validate the assumptions and move forward to the UI phase.
The visualization of the data was a big part of the project, according to the users selection from the top menu, the data range and the space type were going to display different widgets. The design of those widgets was directly related with the purpose of the information, for example a detailed trend log would give the user information about which hours the selected space had very poor utilization, which would trigger an alert, helping the company to take actions on the way the spaces are distributed and used.
The Architecture of the information and the data visualization helped the overall goal of helping the user understand and take actions on how to improve the efficiency of the overall building with the help of the IoT technology.
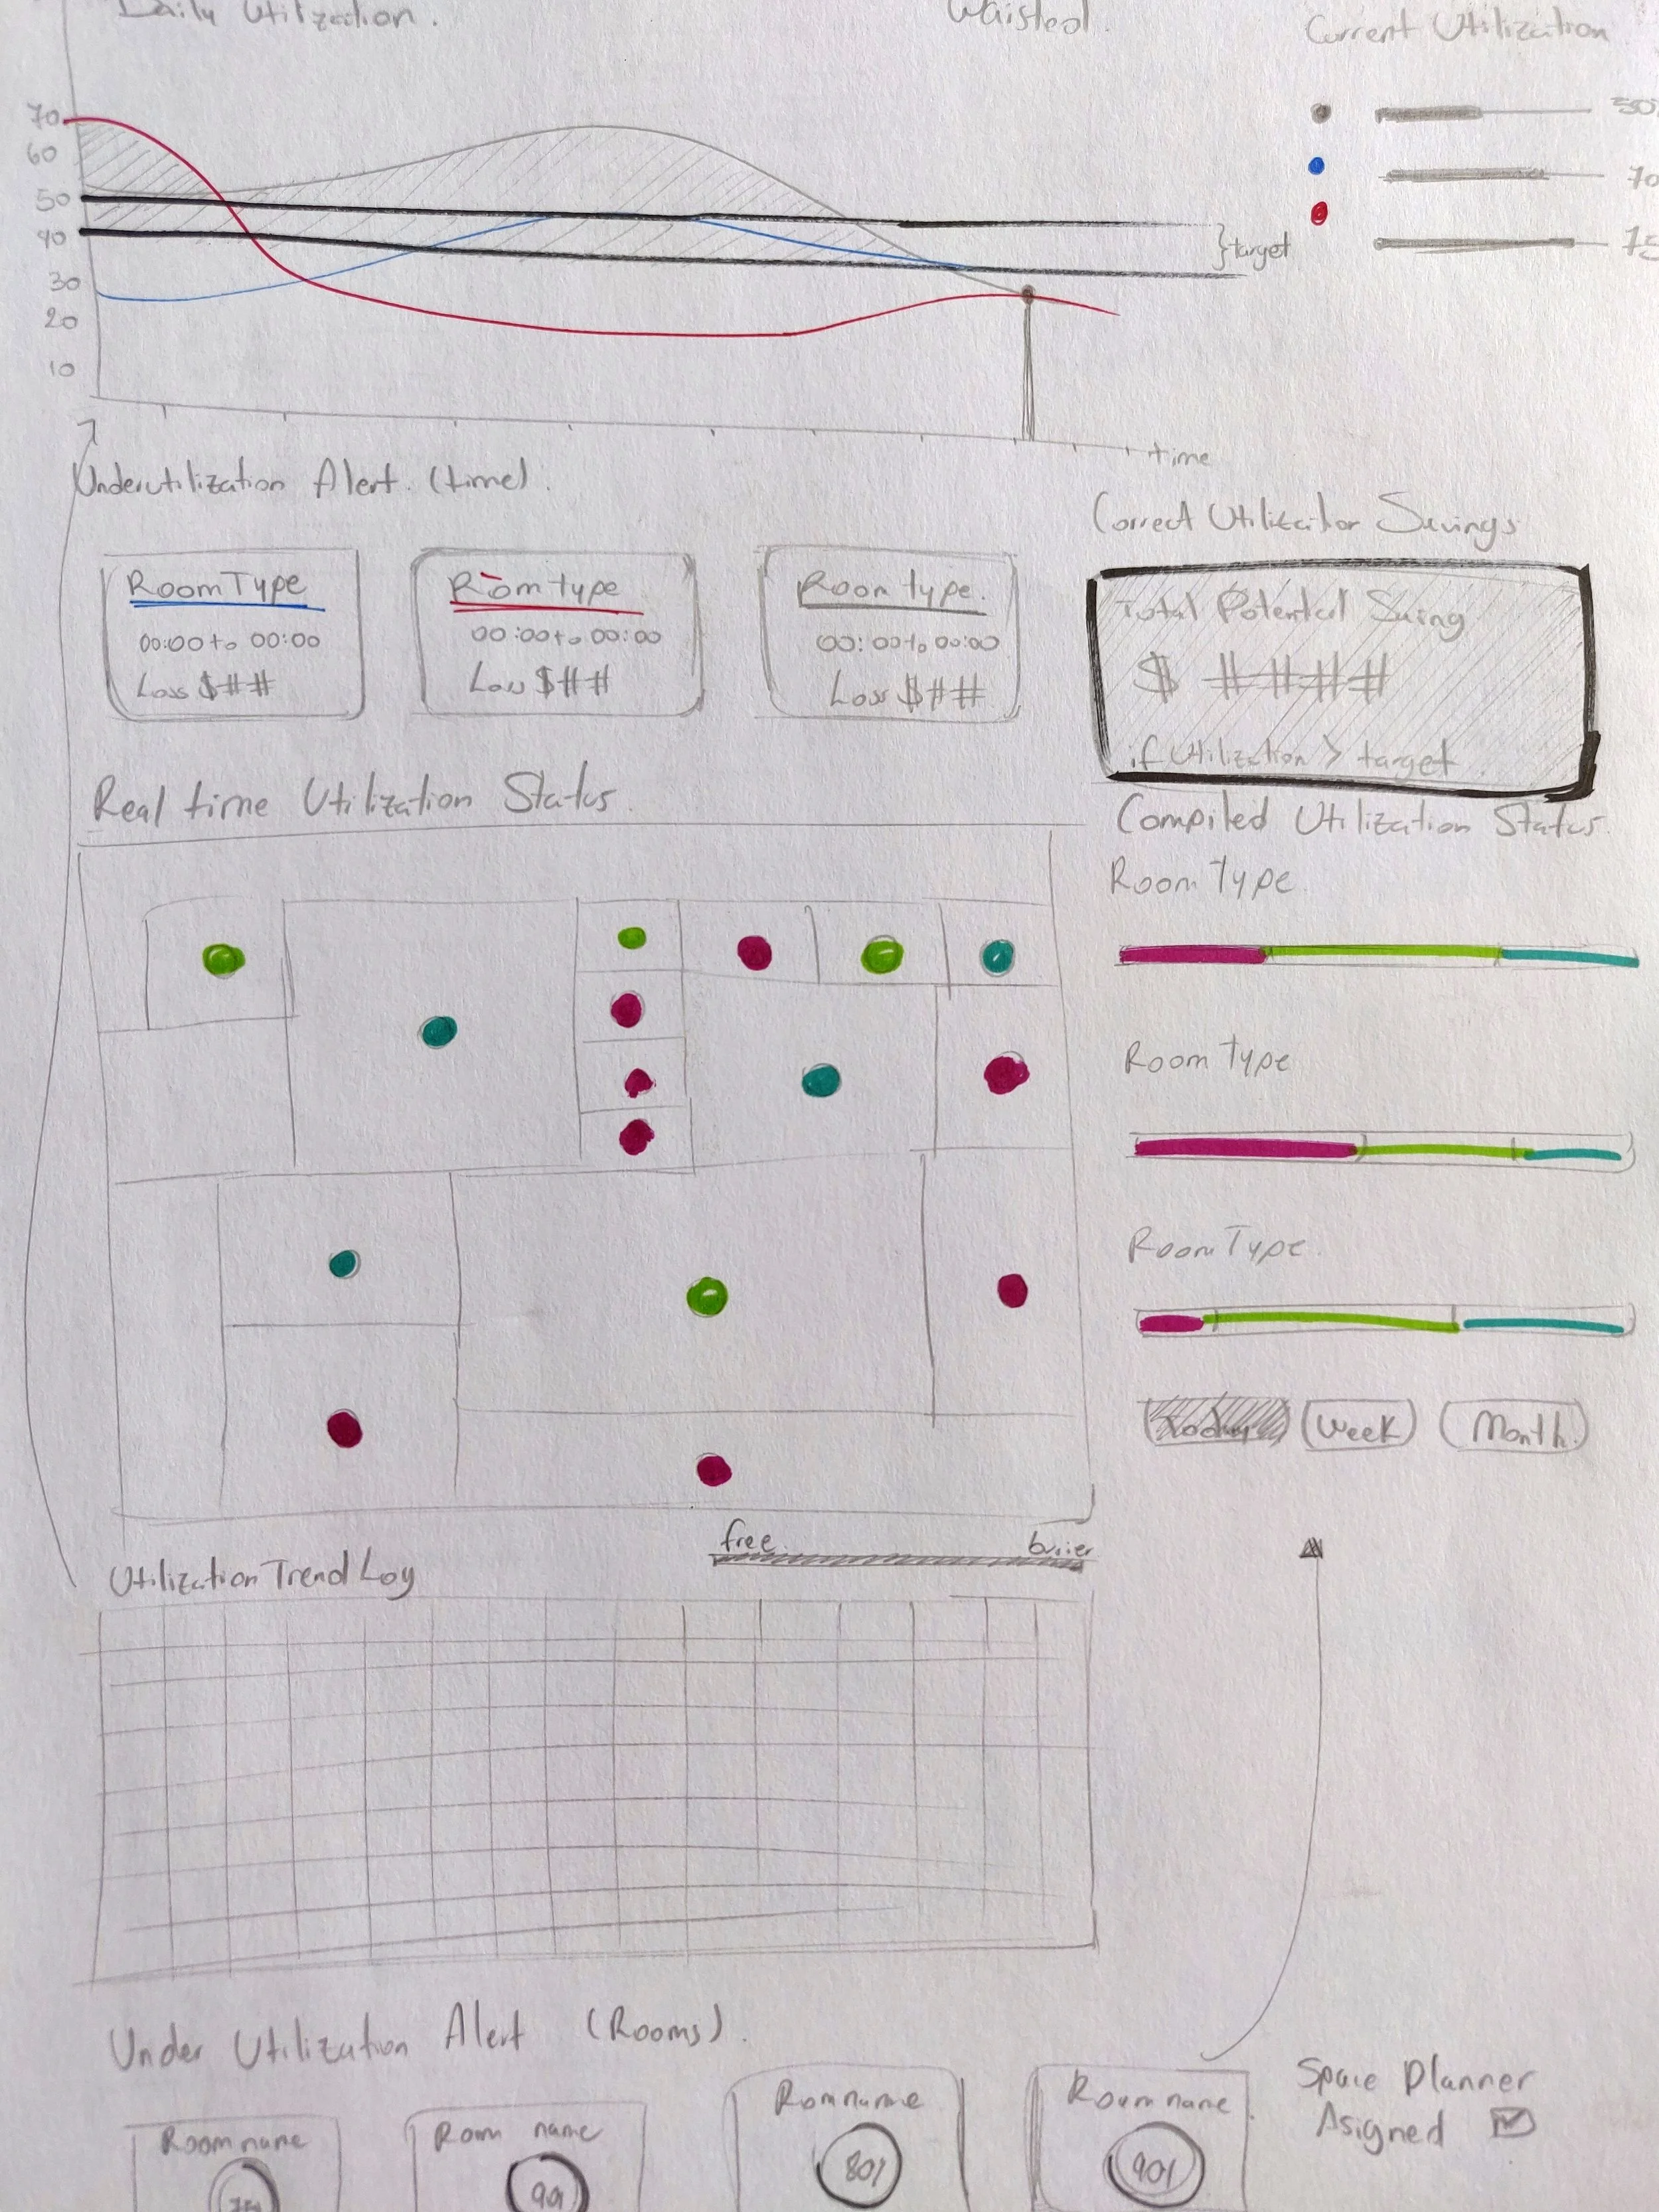
Sketching and ideation
My role
My role started in the first conversation with the customer in which the requirements were gathered. I conducted the interviews with the customer and some users in order to identify both needs.
Later on I was in charge of sketching the proposed solution and generating wireframes in order to be presented and validated with the customer. The last phase was the User Interface, that was also part of my responsibilities in the project. The entire process was accompanied by the IoT Data Engineers and the Backend and FrontEnd developer in order to validate the viability of the designs.

Wireframing and prototyping process
The result
The result is a web based Dashboard connected to data that is being received, processed and visualized in real time.
By analyzing and visualizing the data in an intuitive way, Volteo pretends to give the customer visibility about what the target utilization should be for specific spaces, how much money could be saved if the space is distributed correctly and also to give both real time and utilization over time by providing the user to filter by space type and date range.
The Dashboards are still under development by the Volteo team.