Food Safety Tool (Human Centered Design)
Prototype design of an information system for "Salas Situacionales" (Situational forums for food safety) in Guatemala. The political decision making process affects the levels of malnutrition and agricultural production of the dry corridor, therefore this project aims to generate a tool that provides data visualization and information clarity to take data driven decisions and ensure the food safety. This project was developed during a consultancy for Bioversity International.

Final UI Design
The problem
Guatemala has a "dry corridor" which is a portion of the country that suffers from droughts multiple times a year. The weather conditions are currently supervised by "Salas Situacionales", a monthly meeting in which people in charge of multiple political departments in Guatemala gather together in order to collect data about the hazards of food shortening and declare alerts in order to send resources (specially food) to those municipalities with the higher risk.
The current "Salas Situacionales" are developed during 4 hours meetings and they are not concise, the current data collection mechanism together with the poor documentation of the results put at risk the veracity, not being able to centralize or scale the reports to use them as a guide regarding the different municipalities.
The methodology is not allowing to take correct decisions about prevention of food risk. There is no assurance that the decisions made in the room will be executed in the field. There is no monitoring of the solutions and implementation, nor access and visibility to the history of the "Salas Situacionales". Also the food distribution is being affected by the corruption of the politics in the municipalities, which makes the dry corridor susceptible to deaths of people in need.
Coming up with a solution
The project was developed between Costa Rica and Guatemala, the main goal of the first visit to Guatemala was to organize a Human Centered Design workshop with some participants from the "Salas Situacionales" in order to collect information and generate ideas and prototypes by implementing the following process:
Design Thinking Workshop: The group was divided into 2, they were assigned different tasks in order to pose an innovative solution to the problem posed.
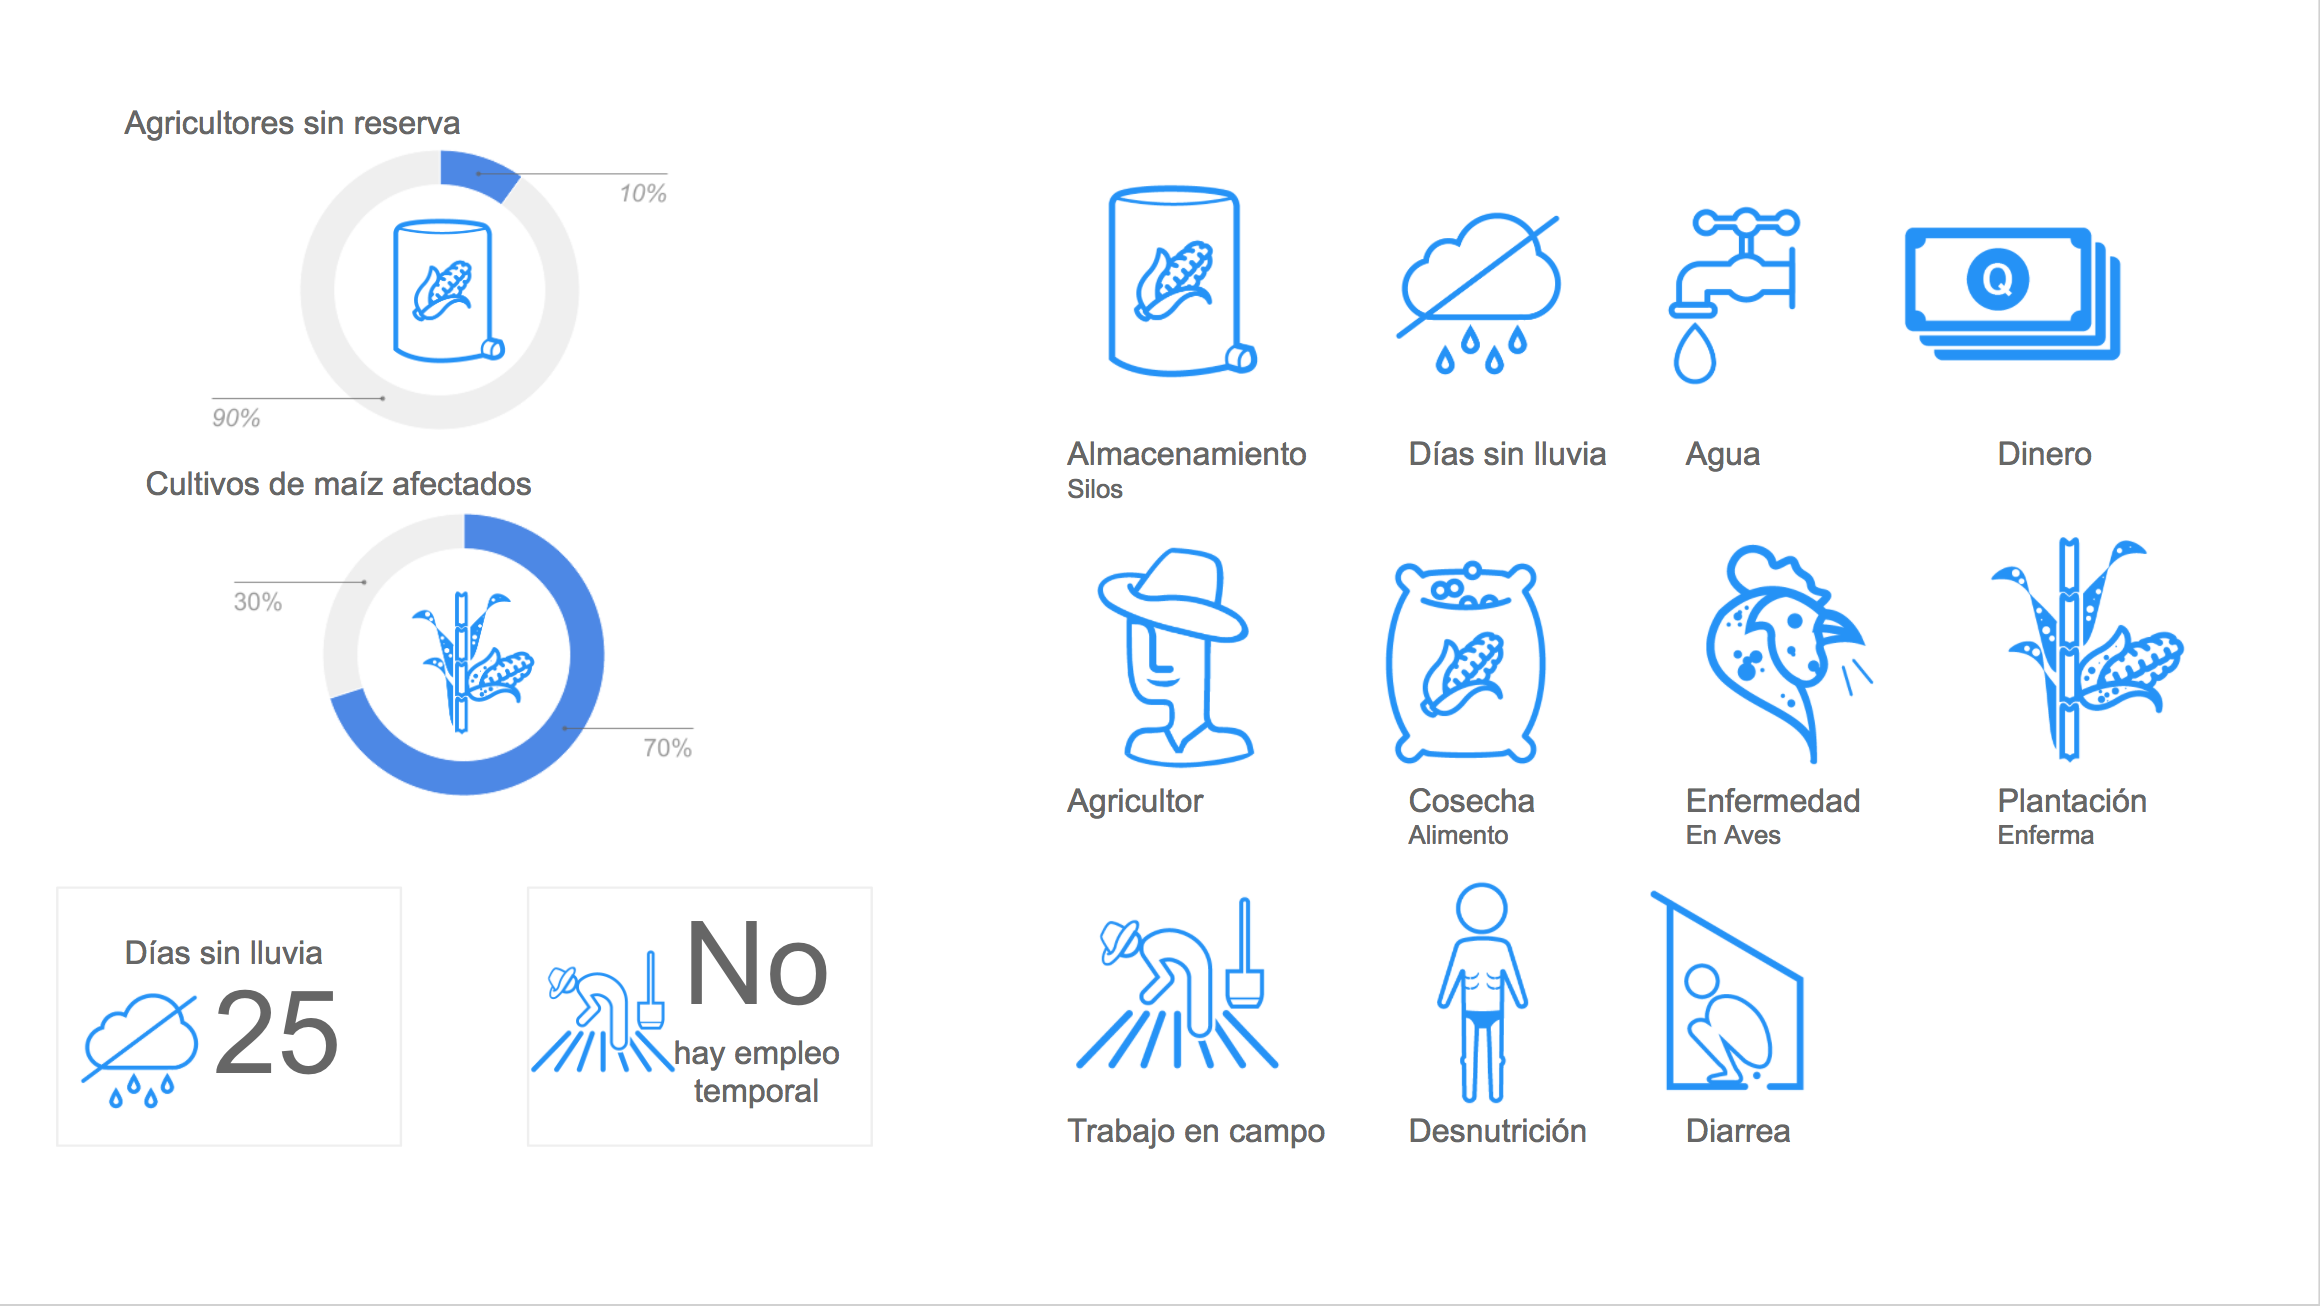
Iconographic Evaluation: The icons that are currently displayed in the information tools were shown in order to identify which are more easily recognized and which are more difficult to understand by users.
Joint Ideation: The workshop facilitator team spent a full day documenting the results and making sketches of the new information prototypes.
According to the results of the first visit the prototypes were created.

Group ideation sketches during HCD session

Conduction a HCD workshop in Guatemala
One of the main goals of the project was to reduce the time needed to collect the weather information and analyze the data, this was possible for the users by uploading the data using template forms. By doing so they didn't have to wait until the "sala situacional" (which happens once a month) to send the data and this solution enabled them to implement BI and improve the decision-making process.
The system made possible to determine which level of alert to declare in each municipality of the dry corridor, this would facilitate the food distribution process by making sure that the resources would be given to those who were in municipalities with the higher risk of suffering from food shortage, therefore avoiding deaths.
My role
I facilitated the Human Centered Design workshop during my first visit to Esquipulas (part of the dry corridor). My role in this project was to conduct user interviews in order to understand the problem and the political environment. I also worked in the creation of the icons, the online prototypes and their validation during my second visit to Guatemala City.
The result
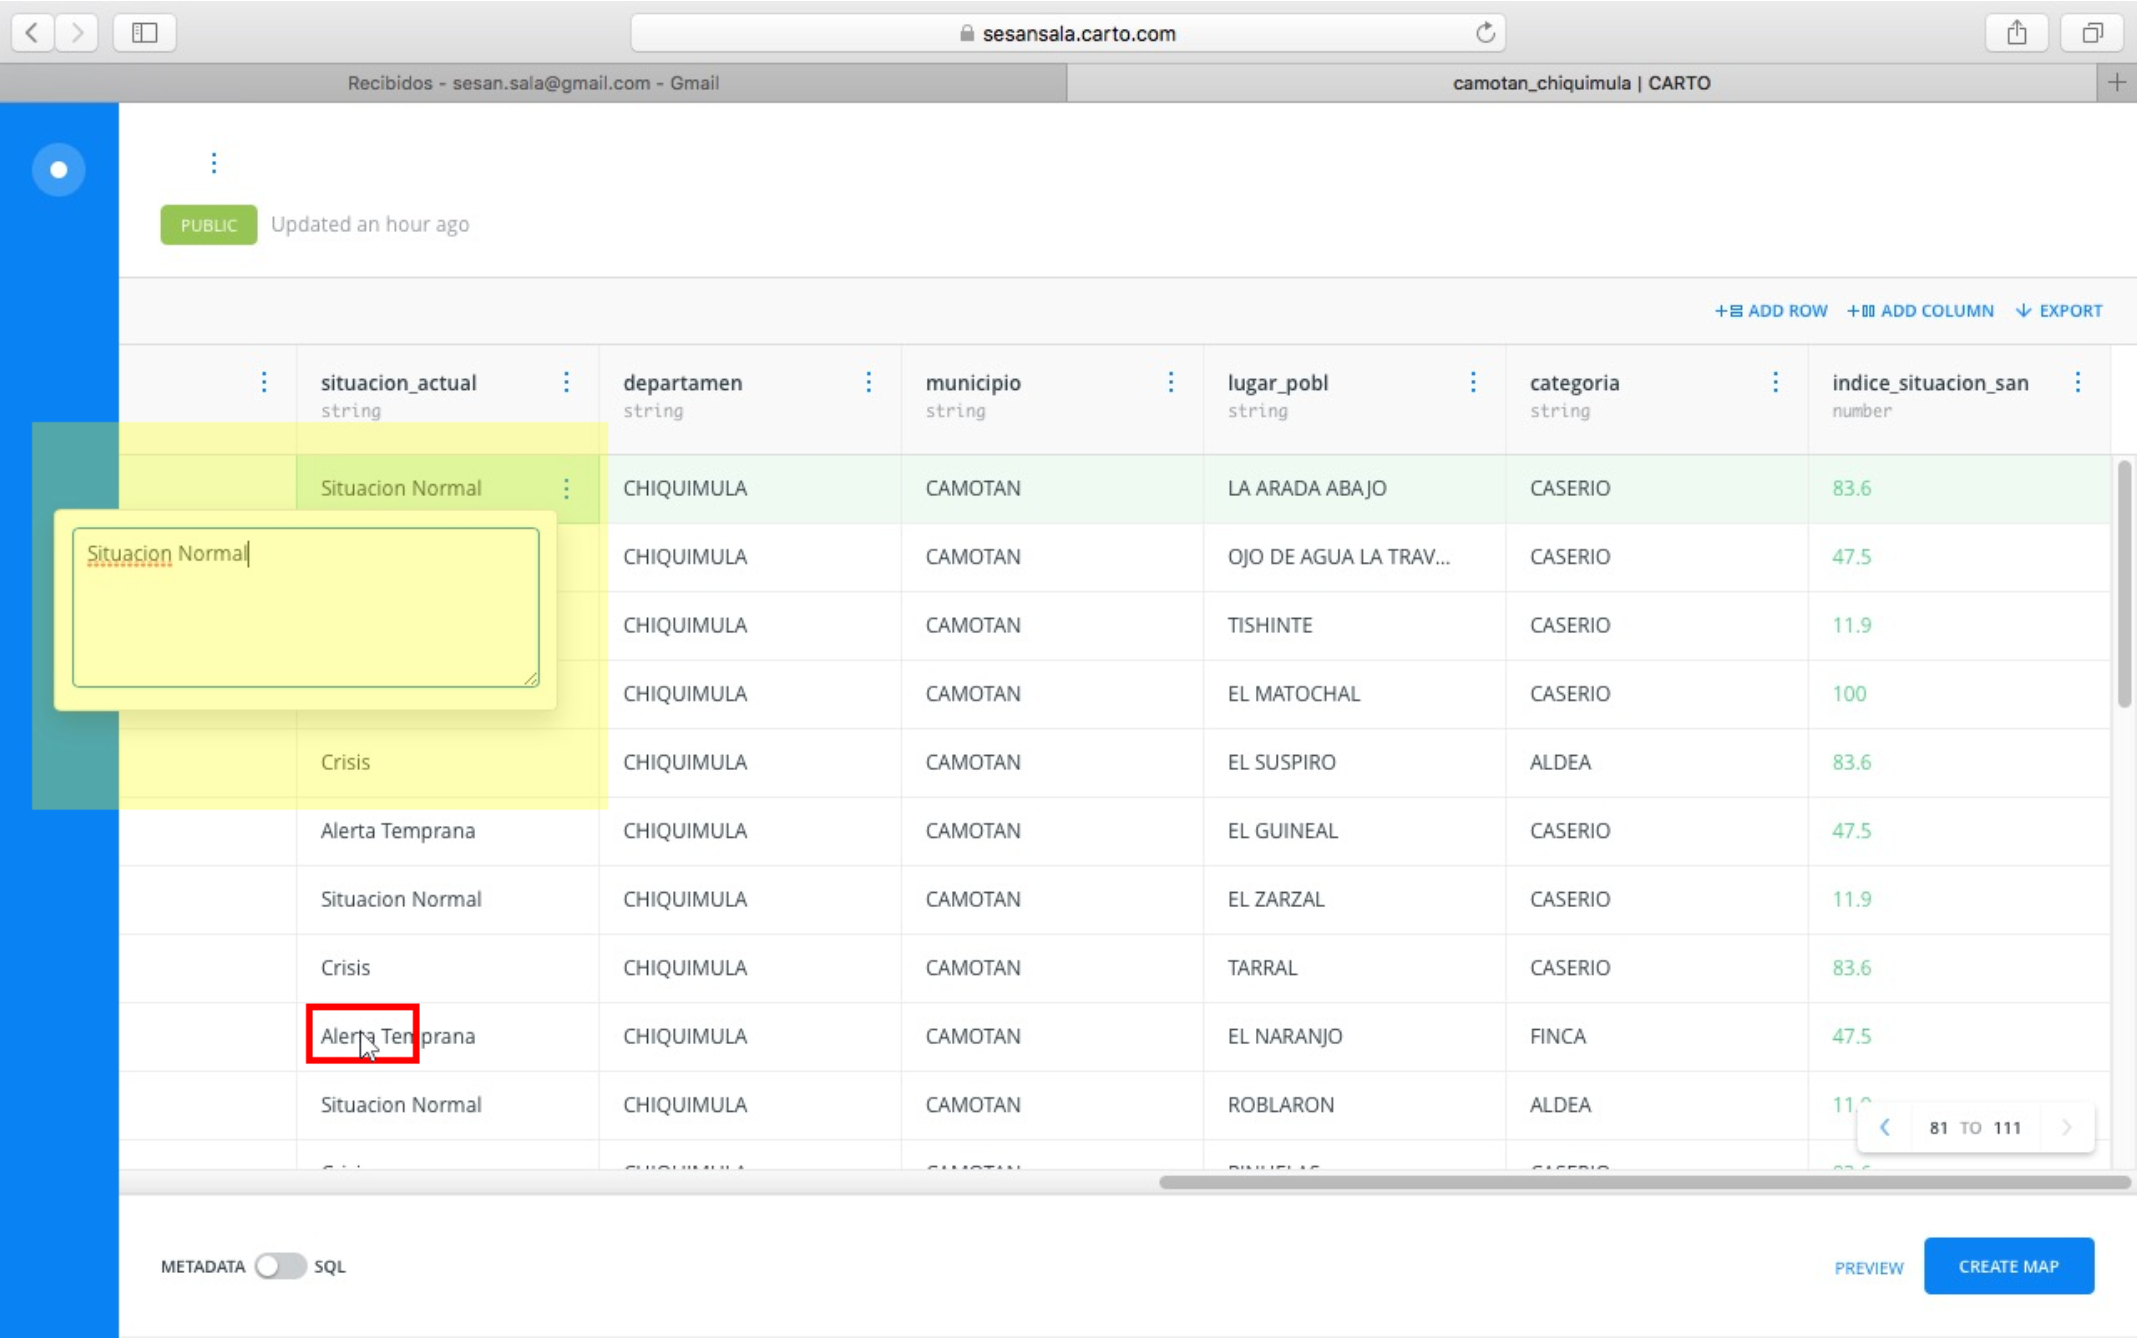
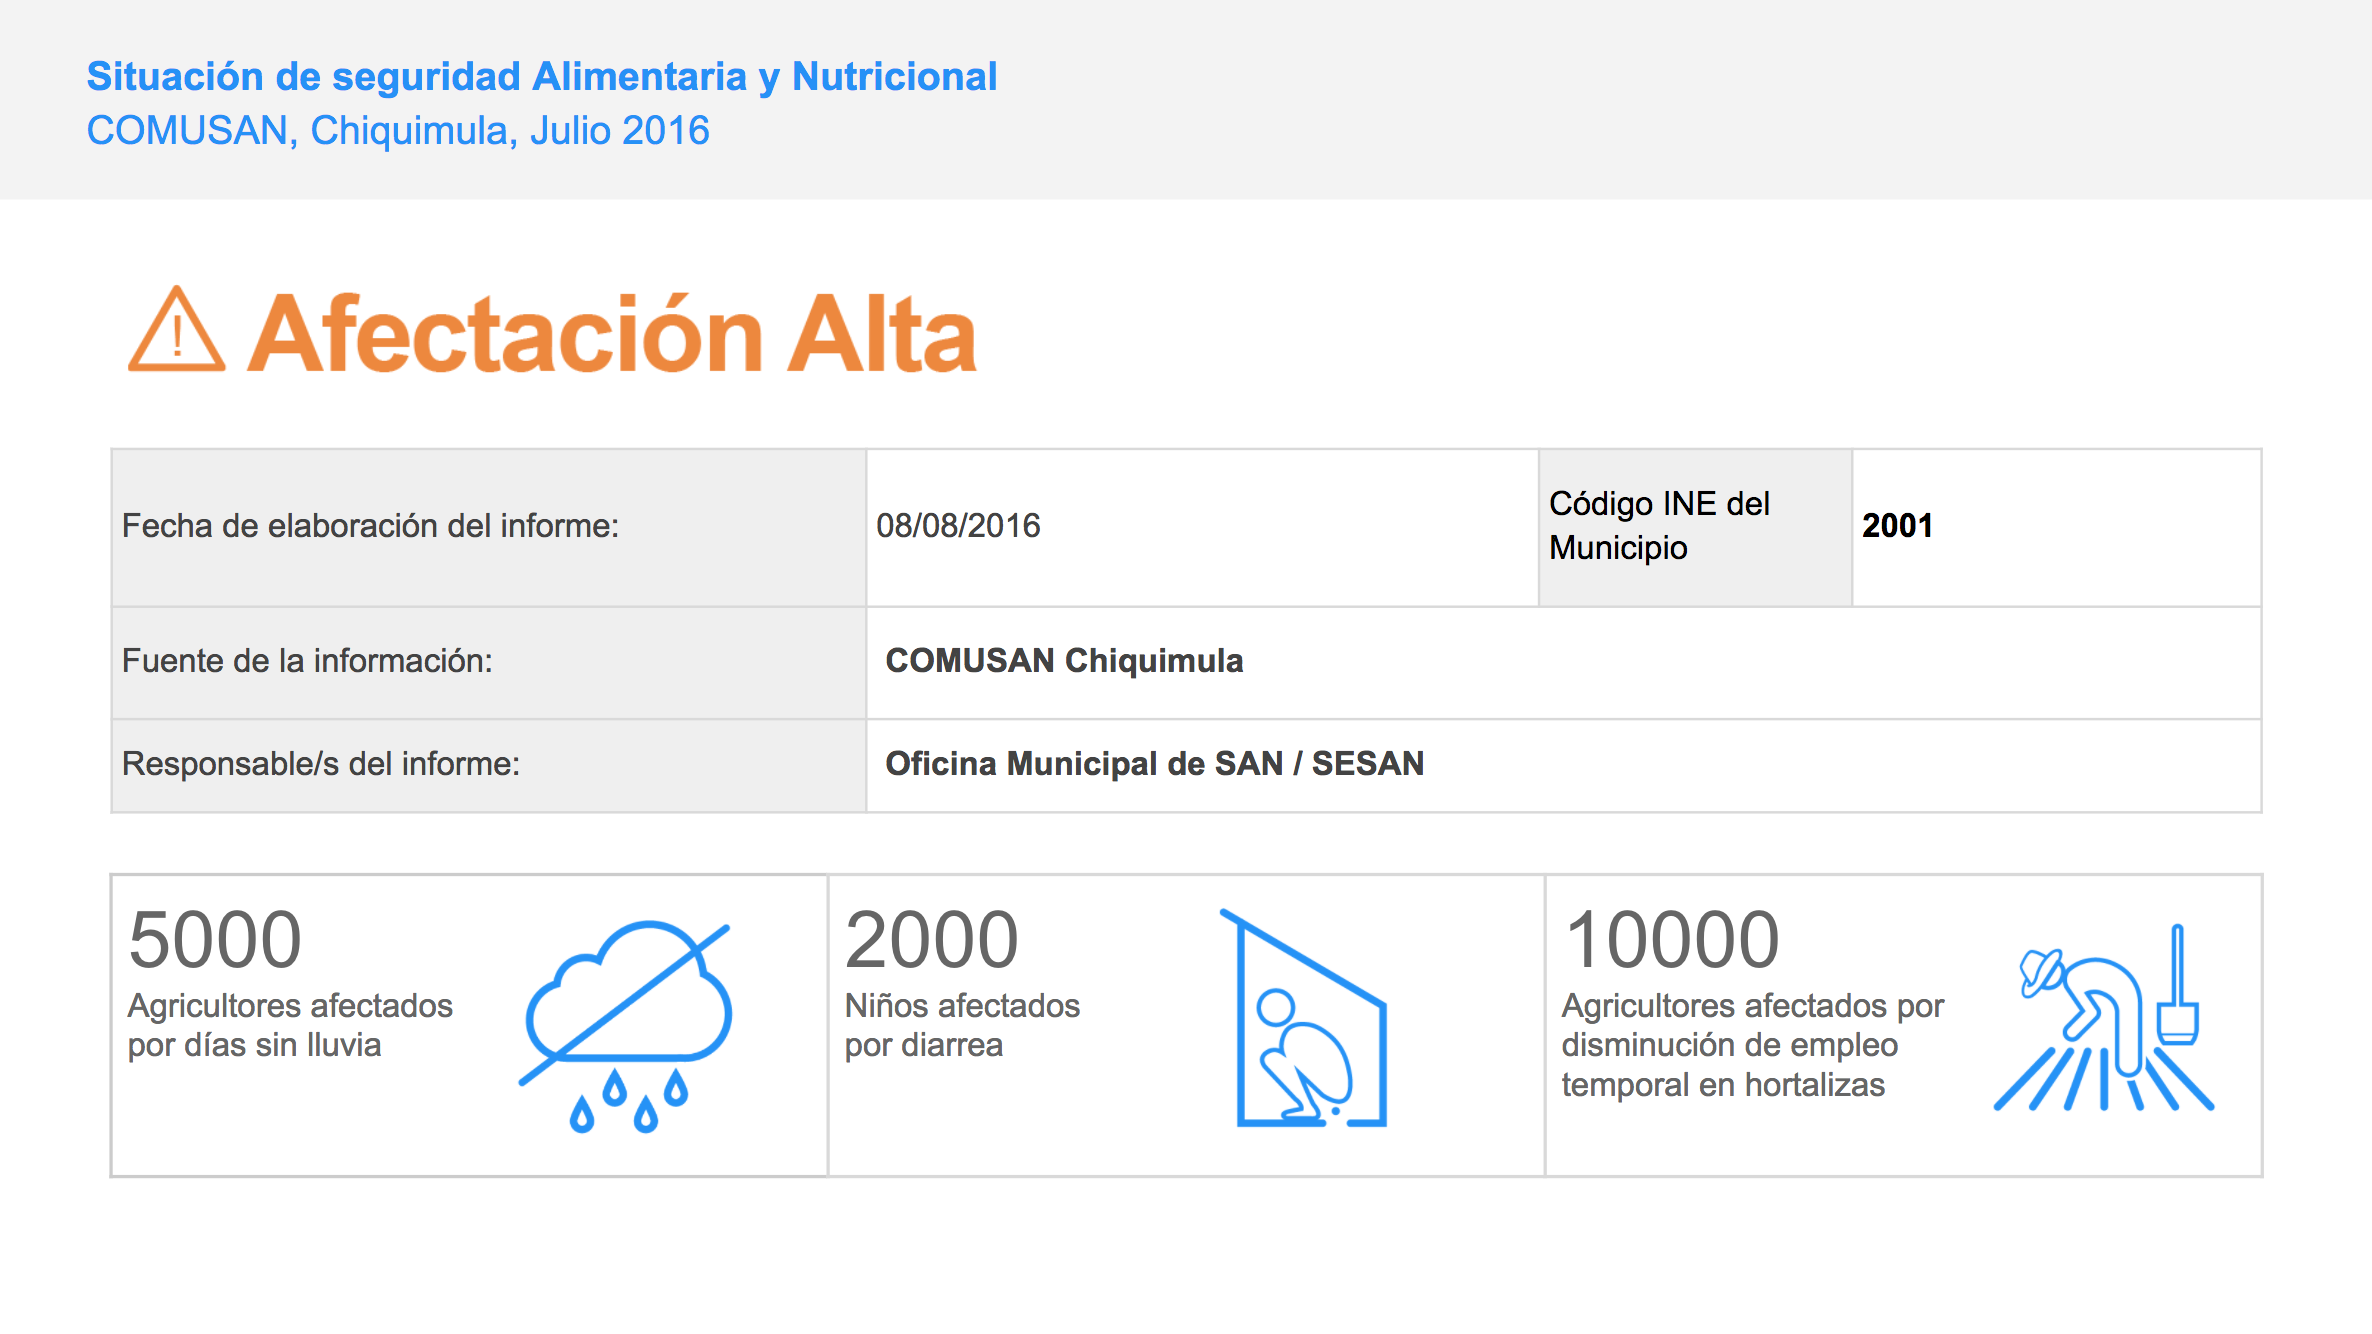
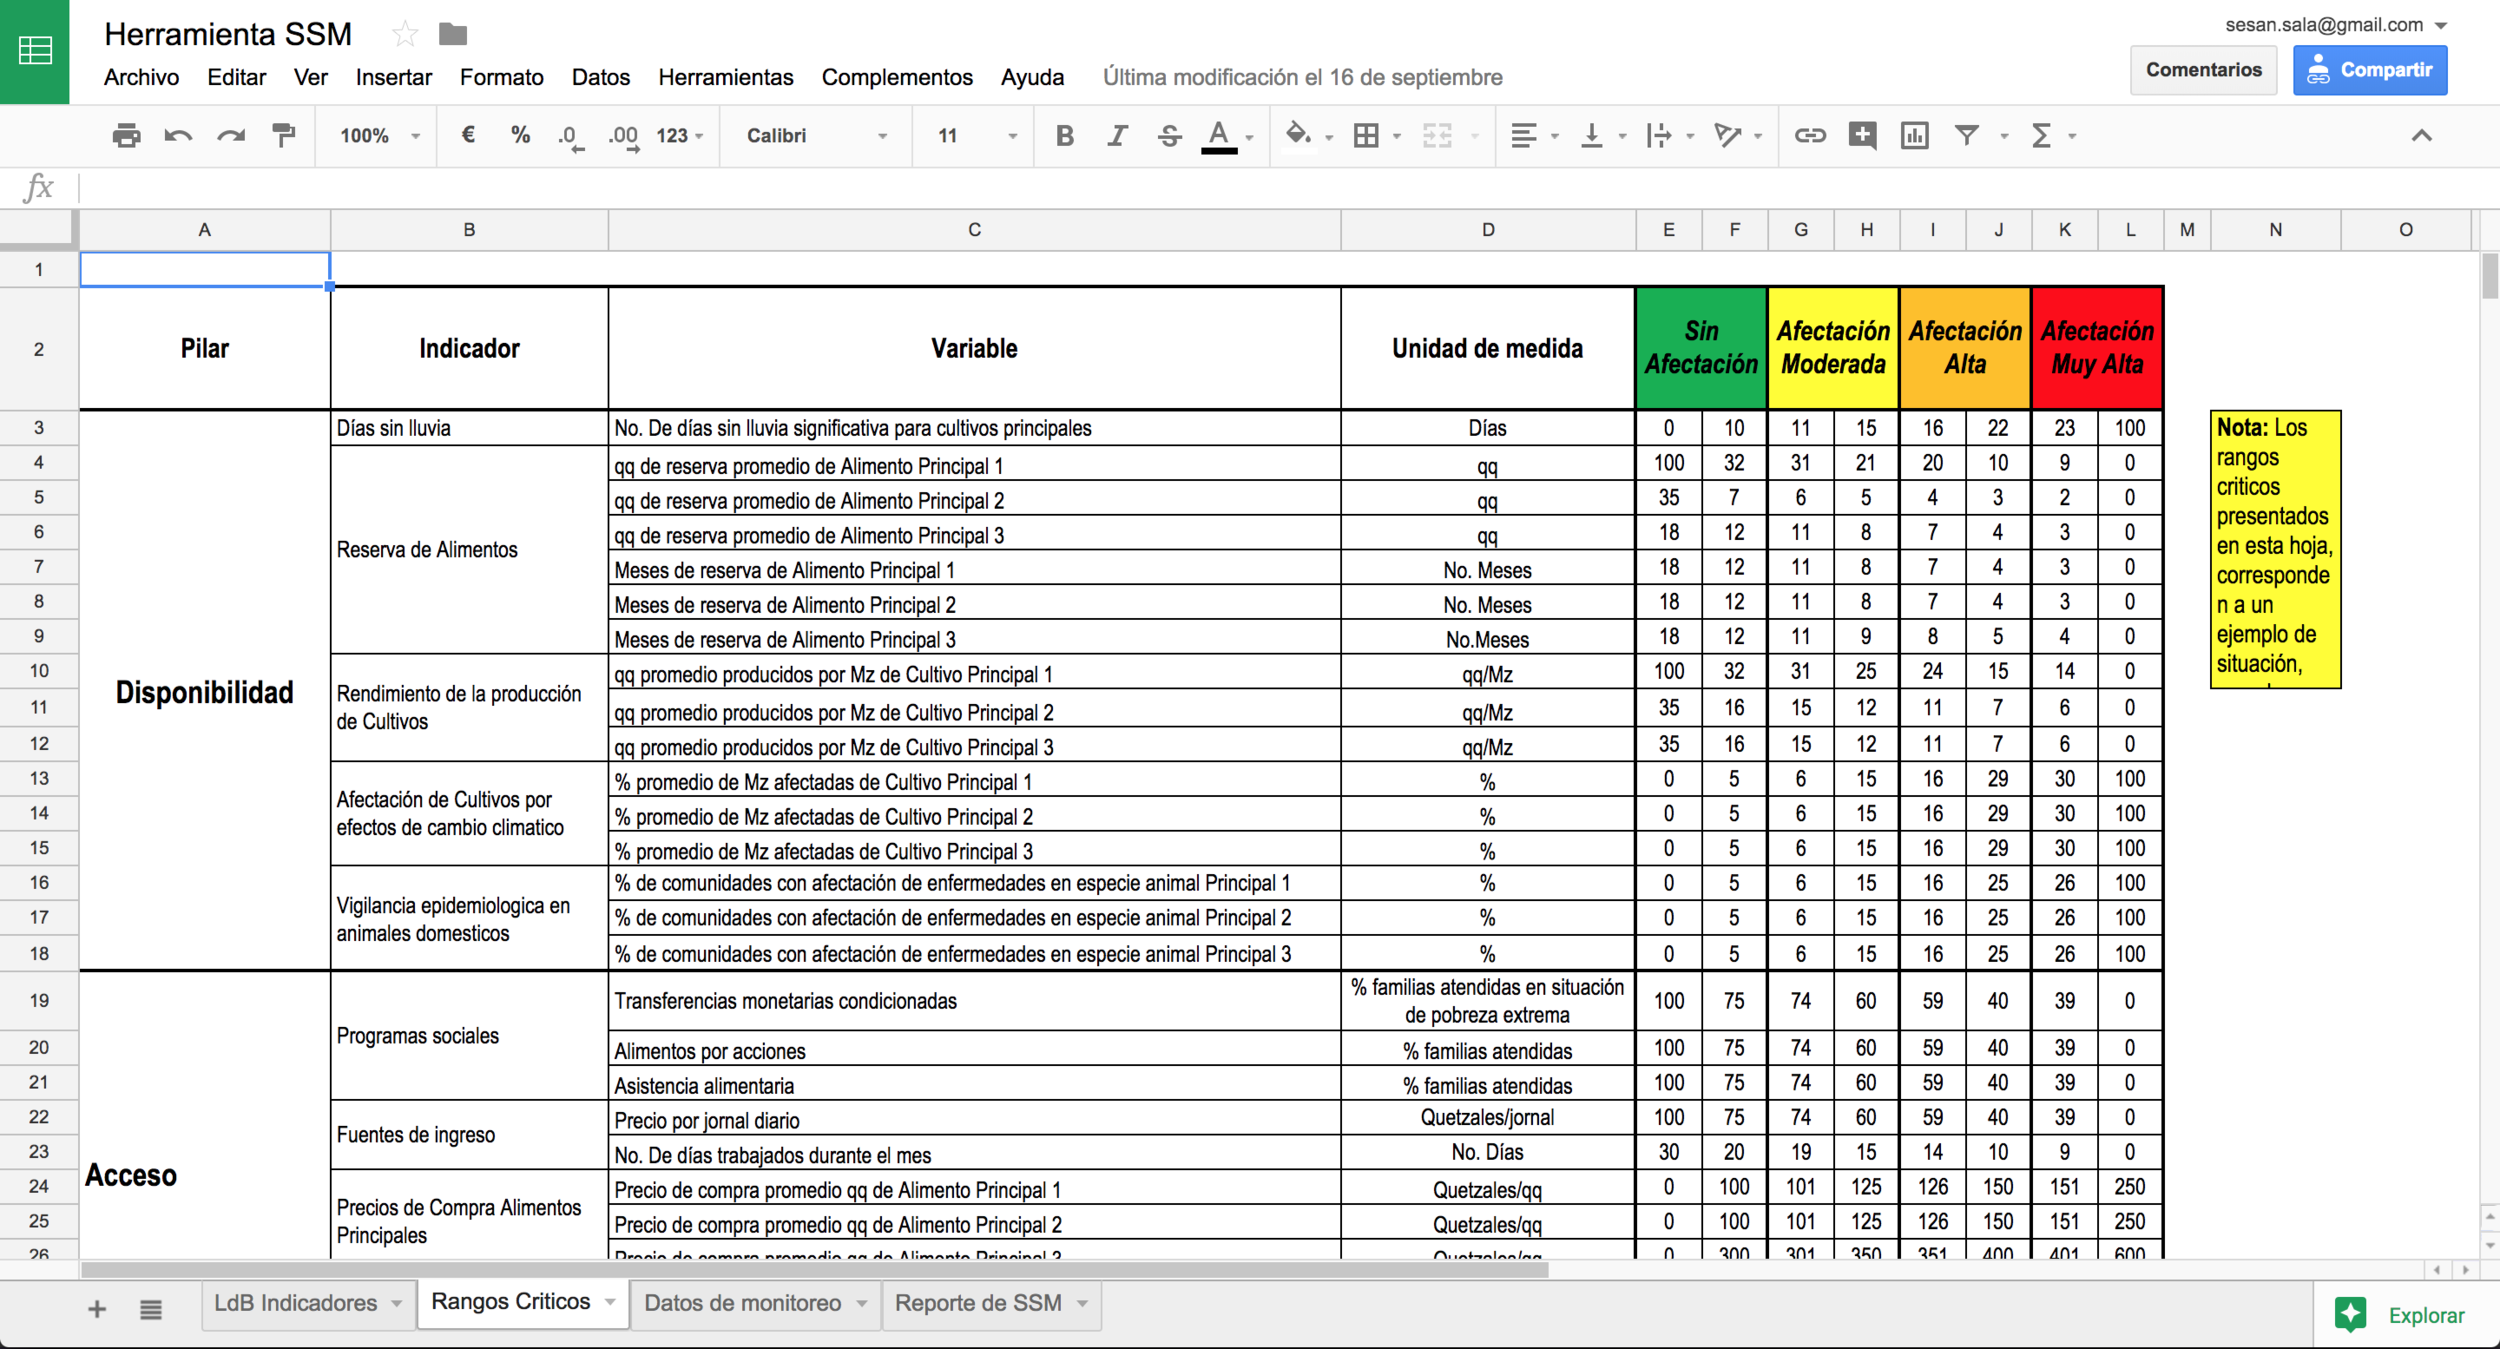
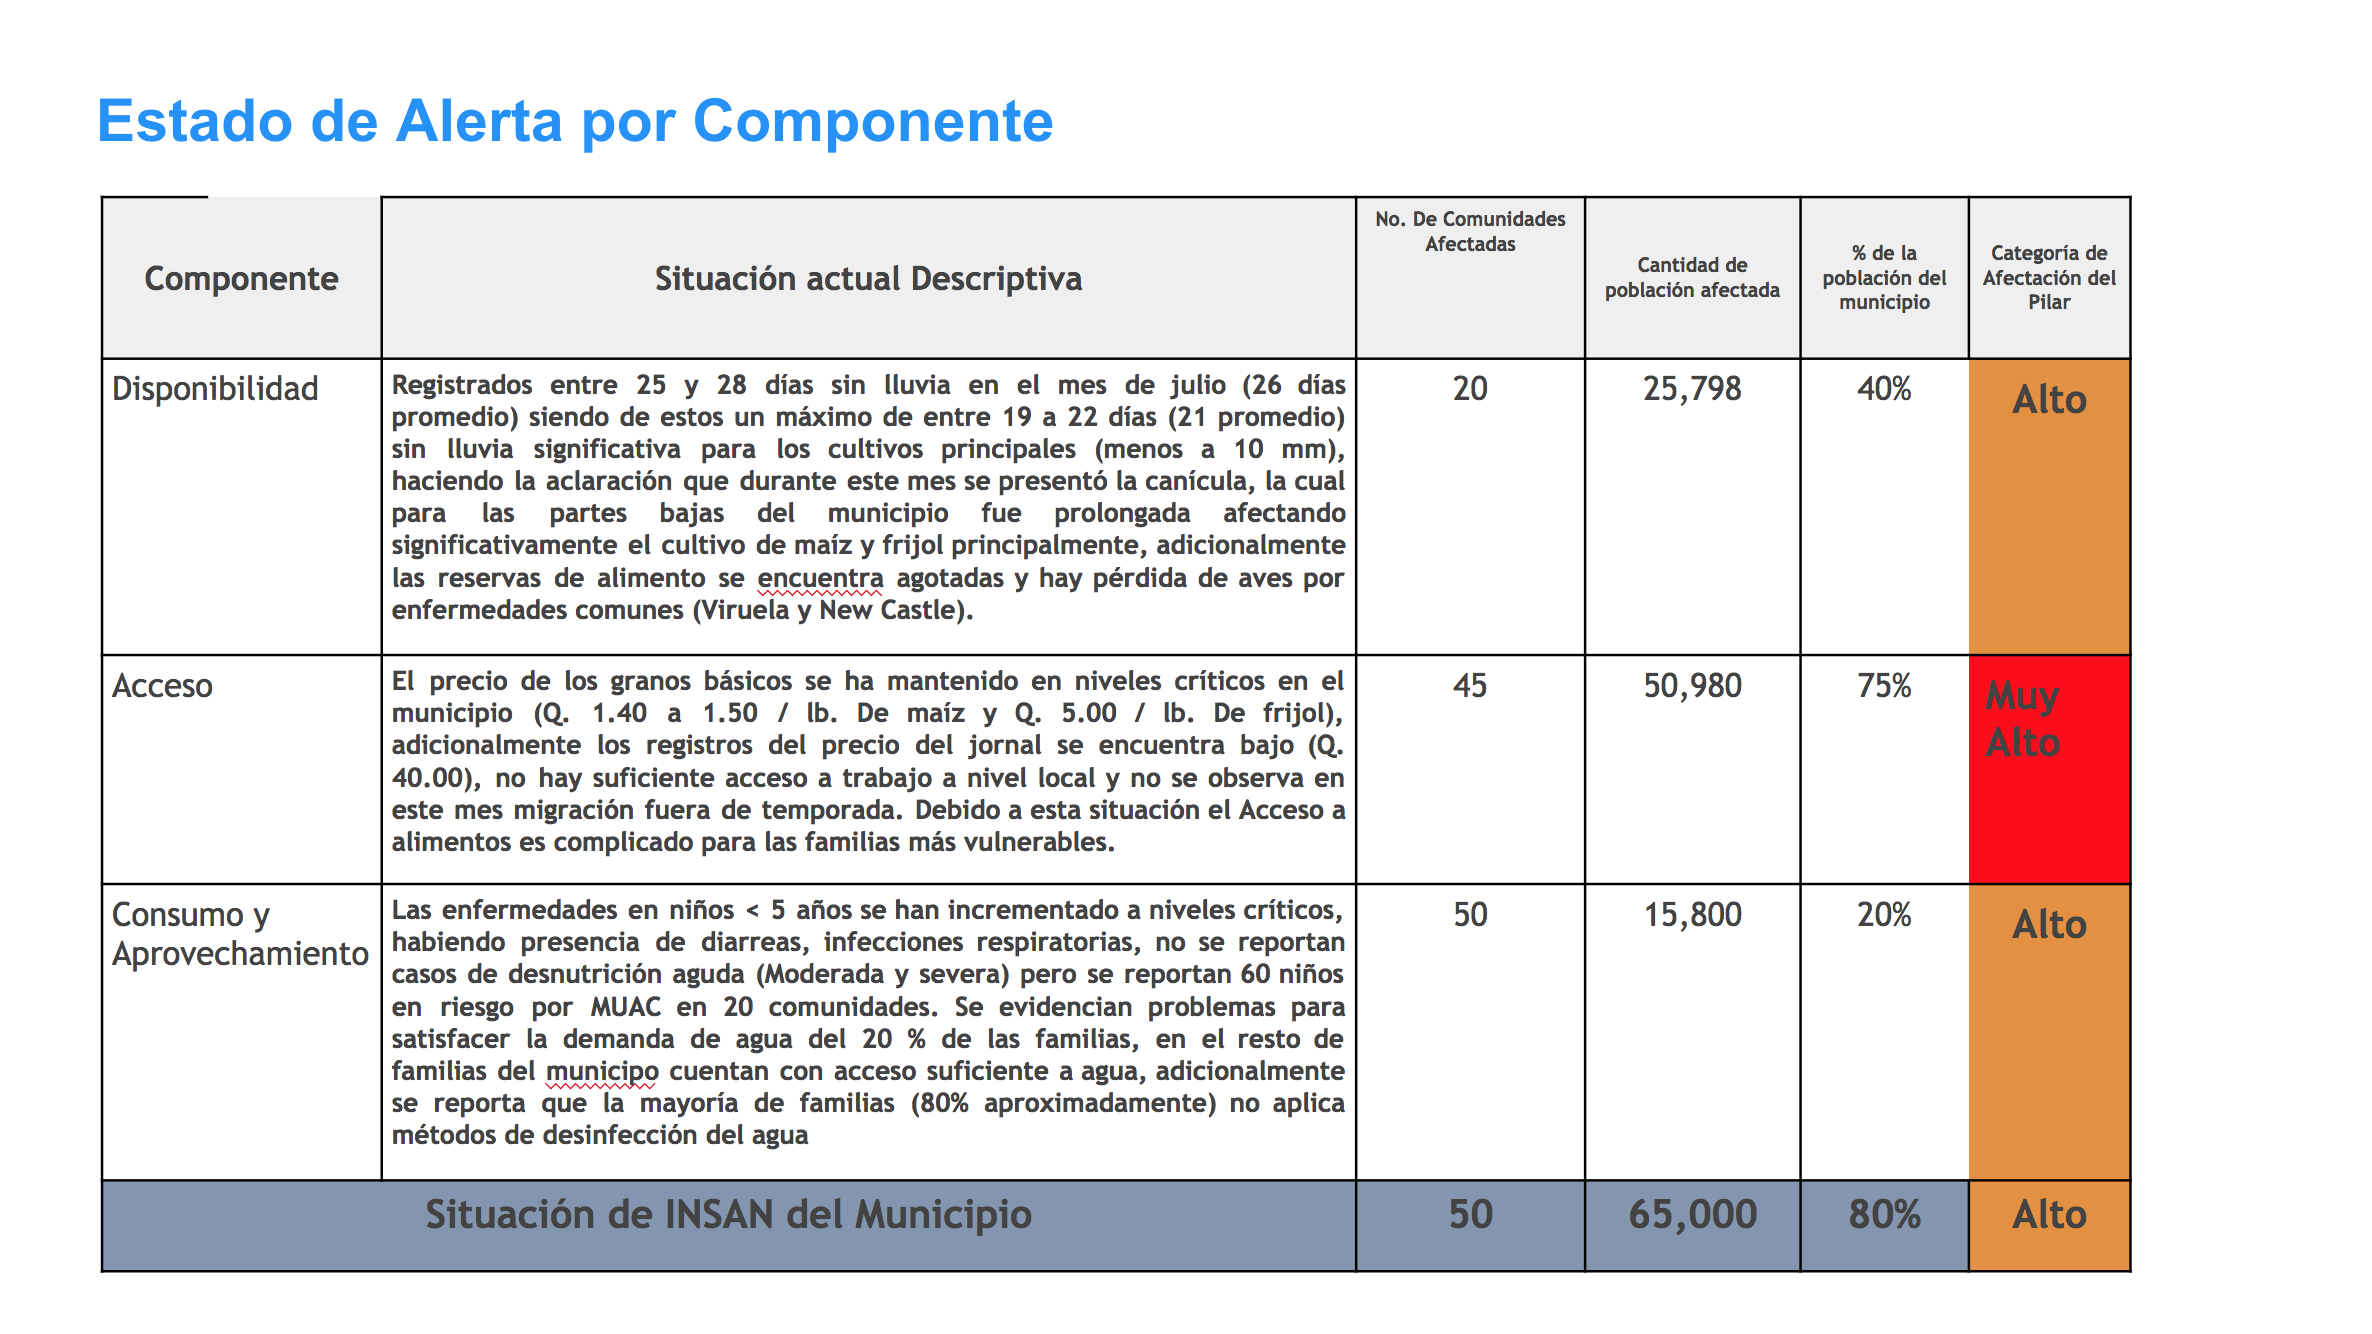
The result is an online prototype of information using the Google Drive and CARTODB platforms. In Google Drive we created forms for each organization to fill with monthly data, graphics were created with the information provided. Furthermore two presentations were automatically populated with monthly data, each month the header of the presentation and the report for the municipalities indicate the level of alert (with color coding from green to red) which ensures that the politicians could see that information first and assign resources to those in need.
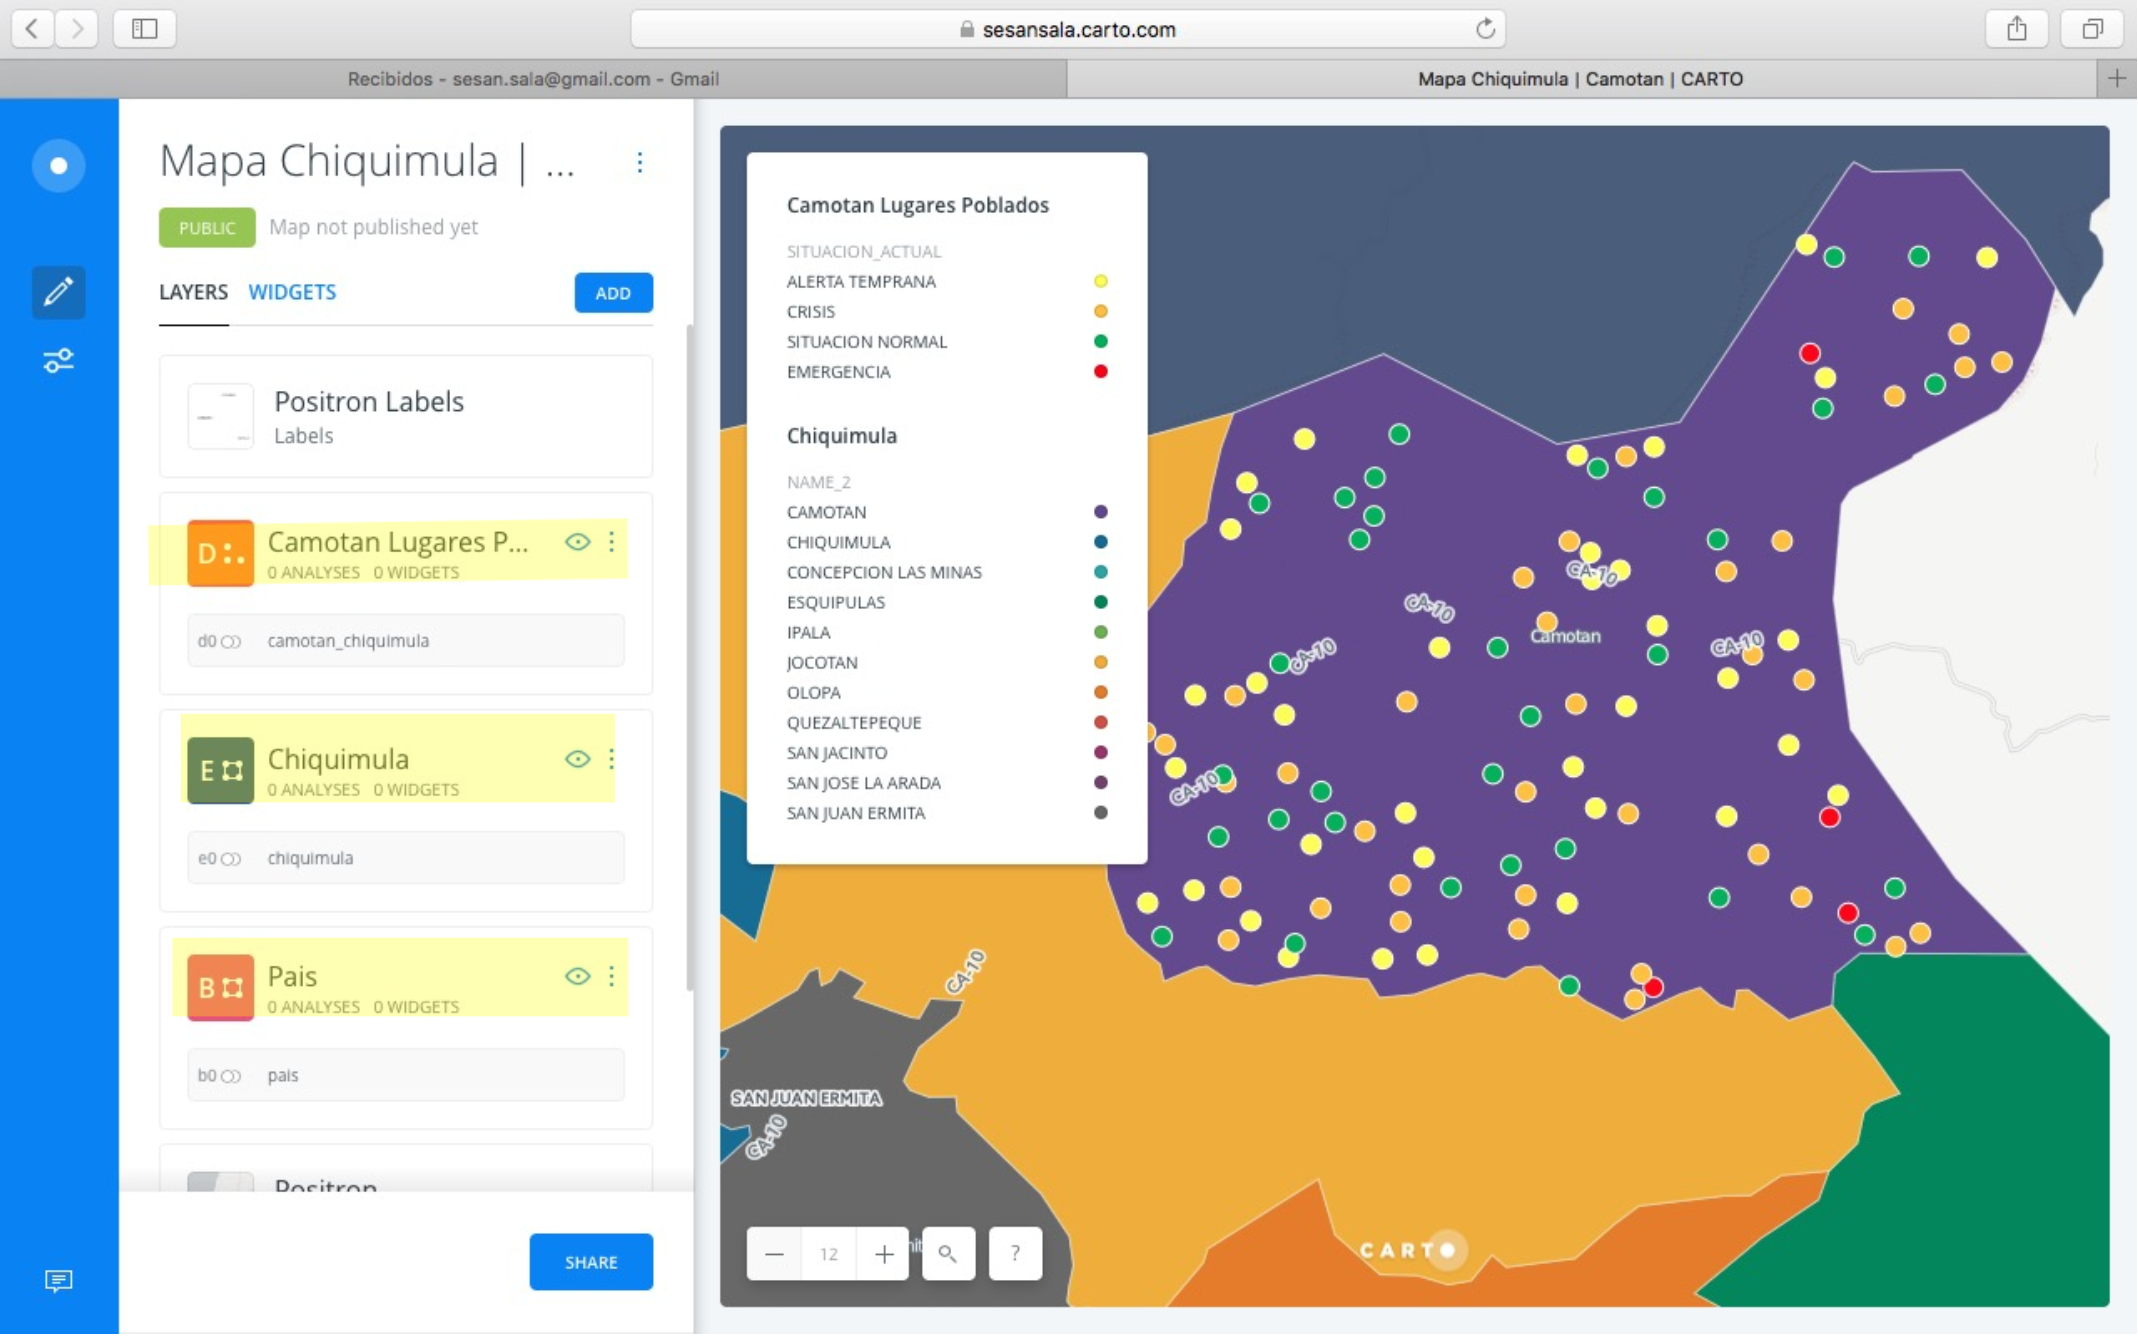
The CARTODB map represents the levels of alerts using colour-coded dots in top of each municipality of the dry corridor. This data is obtained from the Google Drive prototype that is populated monthly therefore the colors in the map will change according to the level of alert needed to declare.
The tool was validated with the participants of the "sala situacional" in Esquipulas and also political forces from different government organizations in Guatemela City.
This project was developed for Bioversity International, in collaboration between the team in Costa Rica and other organizations in Guatemala such as CATIE and Acción contra el Hambre. The Human Centered Design and research phase was developed with Ana María Montero. The project is currently under the development phase of an online platform following the specifications of the created prototypes.